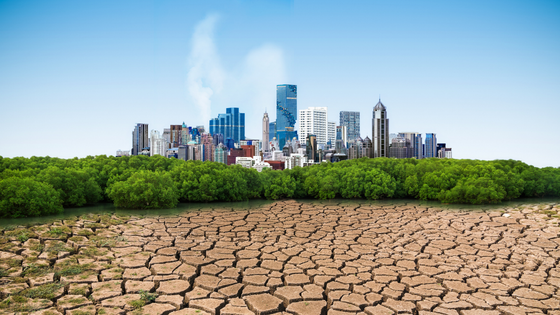
One of the main reasons for global warming is the sustained increase of CO2 emissions, trapping heat and warming up the atmosphere. With more frequent storms, landslides or floodings, climate change will make buildings more vulnerable and reduce their lifespan. As energy plays a key role in the management of buildings, in this article, we will discuss the consequences of climate change and increased CO2 emissions on the building’s energy consumption and occupant comfort. For the following calculations, we will use Building Energy Modelling (BEM) to evaluate how an office building will behave in the near (2050) and distant future (2100) compared to the year it was designed (2000).
As you might know, Dexma uses BEM for many purposes such as simulating the impact of energy efficiency retrofits, estimating the disaggregation of energy consumptions, or evaluating the impact of different scenarios.
Measuring the impact of Climate Change on Buildings: External factors
To represent the effect of climate change on buildings, we will focus on the following significant weather parameters for the built environment:
- Atmospheric CO2 concentration in PPM
- Outdoor Air Temperature in ºC
- Outdoor Air Relative Humidity in %
The effect of other meteorological parameters like wind speed, solar radiation or rainfall has been neglected whether due to the lack of literature or due to the estimated low effect on the building behaviour.
Let’s now look at these three parameters, their definition and their impact on the building’s performance.
1. Atmospheric CO2 concentration
The atmospheric CO2 concentration is expressed in Parts Per Million (PPM) and fluctuated between 200 and 300 ppm in the past centuries.
Based on the OECD Environmental Outlook Baseline projections, the current atmospheric CO2 concentration has been around 400 ppm since the 2000s, reaching a new threshold. Atmospheric CO2 concentration is predicted to continue rising up to reach 530 ppm by 2050, and 780 ppm by 2100.
If we want to see these alarming numbers decrease, we are left with no choice but to significantly reduce our emissions. However, even if we were to stabilise our CO2 emissions, unfortunately, this would not be immediately noticeable. Indeed, it takes time for the CO2 emitted to be eliminated from the atmosphere naturally: whereas some cycles are fast and can eliminate CO2 in 5 years, the absorption of CO2 by the soil, the oceans or the vegetation can take thousands of years…
2. Outdoor Air Temperature
The Outdoor Air Temperature, or Dry Bulb Temperature, is basically the one we refer to when speaking about air temperature. It is called “Dry Bulb” because the air temperature is indicated by a thermometer not affected by the air moisture.
Based on the same OECD projections, the outdoor air temperature will increase, compared to 2000, by 土 2ºC by 2050 and by 土 4ºC by 2100.
This temperature change affects us all. It is causing regional and seasonal temperature extremes while reducing snow cover and sea ice, increasing heavy precipitation and changing the range of plant and animal habitats – expanding some and reducing others.
“The Earth’s temperature has risen by 0.08° Celsius (0.14° Fahrenheit) per decade since 1880, but the rate of warming since 1981 is more than twice that: 0.18° C (0.32° F) per decade”, as highlighted by this Climate.gov report.
3. Outdoor Air Relative Humidity
Relative humidity (RH) is a measure of how much water vapour is in a water-air mixture compared to the maximum amount possible. It is given as a percentage from 0% (absolutely dry air, zero moisture content) to 100% (air saturated with moisture, any additional moisture will condense). There are fewer studies concerning the relationship between outdoor air humidity and climate change, but the one from PNAS indicates a decrease in relative humidity of 0.2% per decade in the last 50 years (illustrated by graph C).
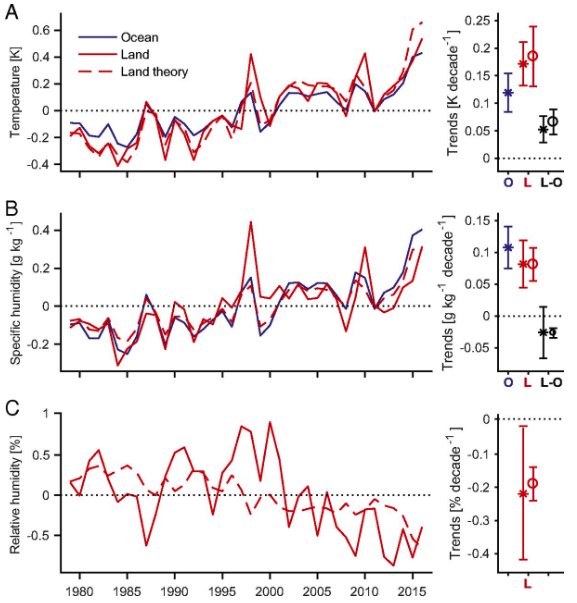
Combined with the increasing Outdoor Air Temperature (Graph A), the total amount of moisture (specific humidity) is in fact increasing as shown by Graph B. Study shows that this deadly combination of increasing heat and humidity could have many direct consequences on health, productivity and could even lead to death even for healthy individuals.
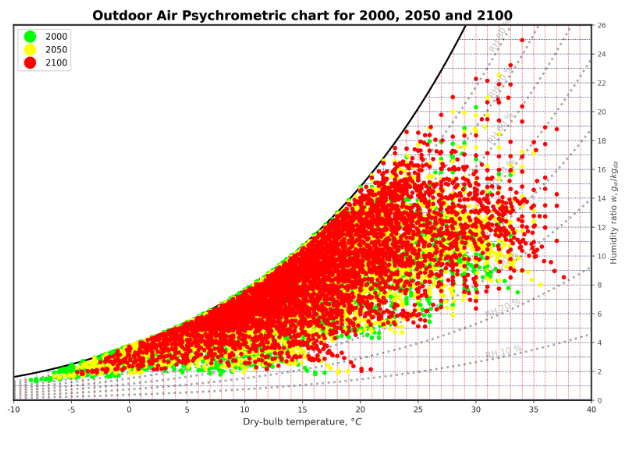
The resulting weather conditions can be summarised in the following psychrometric chart (see here for more information about psychrometric charts), showing the higher dry-bulb temperatures and humidity ratios.
What does it mean for your Buildings?
Well…that’s a good question!
Let’s now imagine an office building in Lyon in France, a temperate region of Europe, built in the 2000s. We will assume a 3-storey building with a heat pump for the heating, and a chiller for the cooling, with a building envelope corresponding to the standards of the year 2000. Thanks to Dexma’s BEM tool you will be able to estimate the impact of climate change on the building thanks to different indicators (IAQ, thermal comfort, indoor air temperature and humidity, HVAC energy consumption), and for 3 different climate scenarios we mentioned: the years 2000, 2050 and 2100.
Impact on Occupant Comfort
Now that we have seen three key external factors impacting buildings, let’s take a look at how the occupants could be affected by climate change.
1. Indoor Air Quality (IAQ)
When common indoor pollutants are understood and controlled, the risk of indoor health problems is reduced and the quality of work and comfort of employees are improved.
One way of measuring the indoor air quality of a room is to measure its air CO2 concentration. This can be done using Dexma Analyse as explained in this article focused on indoor air quality.
Indoor CO2 levels are usually higher than outdoor air ones, due to the CO2 exhaled by building occupants and produced by some building appliances, like gas stoves for example. Therefore, a common rule of thumb is to try to keep the IAQ below 800 ppm where the air quality standard is considered “fresh” and “normal” and to absolutely avoid CO2 concentration above 1200 ppm corresponding to “serious pollution” directly affecting health.
The easiest way to reduce the CO2 level is to guarantee adequate ventilation and thus exchange “polluted” indoor air for, usually, cleaner outdoor air. Let’s simulate the scenarios 2000, 2050 and 2100 for our office model and evaluate how climate change affects the IAQ.
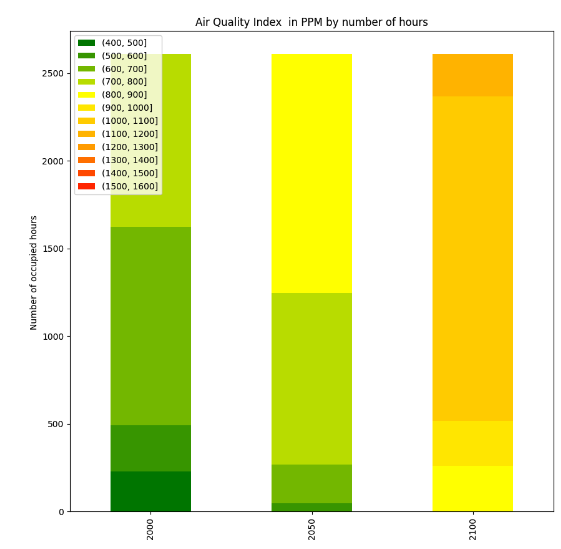
As we can see on the graph, the results display that the IAQ in 2050 (middle column) will slightly deteriorate compared to 2000 (left column), while it will significantly worsen in 2100 (right column), reaching 1200ppm in a dark orange hue. The perfectly sized ventilation system will keep the indoor air quality below 800ppm for the whole year 2000, while the 800 ppm threshold will be crossed during 1363 hours (52% of occupancy hours) and 2610 hours (100% of occupancy hours) for the years 2050 and 2100, respectively.
Dexma Analyse will be of great help in monitoring your Indoor Air Quality in terms of indoor CO2, temperature and humidity and in creating M&V projects for evaluating the effectiveness of your energy-saving measures.
2. Thermal Comfort
Due to the multitude of factors and its “subjective” nature, thermal comfort is usually hard to measure. A way of approximating it has been established in the 1960s by the Danish professor Povl Ole Fanger and is called the Predicted Mean Vote index (PMV). This index is based on the “perception of a large group of people”. It predicts the average vote of a large group of people on a seven-point thermal sensation scale. This prediction takes into account all the following parameters: Metabolic Rate, Clothing Insulation, Air Temperature, Air Velocity, Mean Radiant Temperature, and Relative humidity.
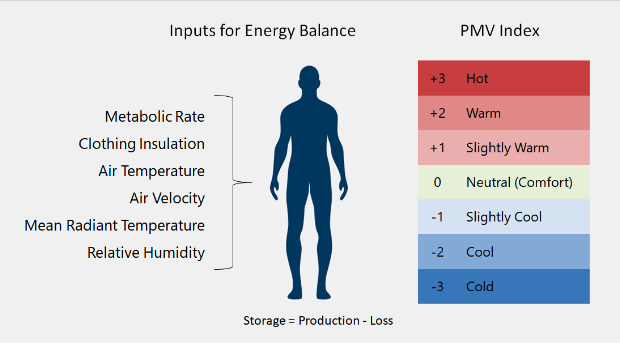
Here are the simulated annual PMV indices for 2000, 2050 and 2100 for an open space from our office model. The open space indoor temperature is maintained between 22ºC and 26ºC during working hours (8h-18h) thanks to its HVAC system.
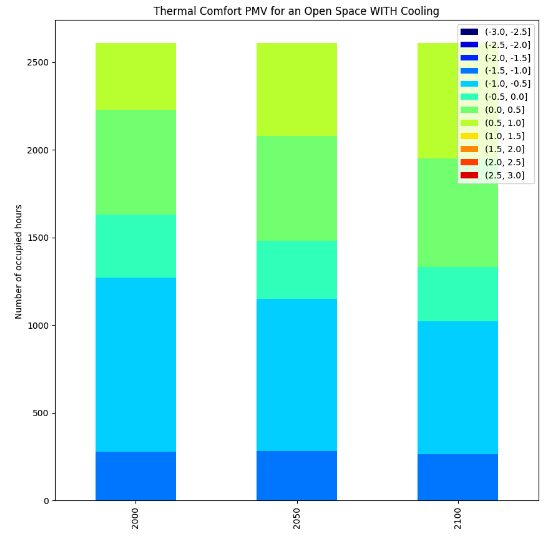
Thus, with a building perfectly air-conditioned, the indoor thermal comfort will only slightly be affected by climate change from a thermal comfort point of view.
Let’s think about another scenario where we remove the cooling systems from our model. What would happen if the only possible way of cooling down the office space would be to manually open the windows when it’s cooler outside, which is still the case for some office buildings nowadays?
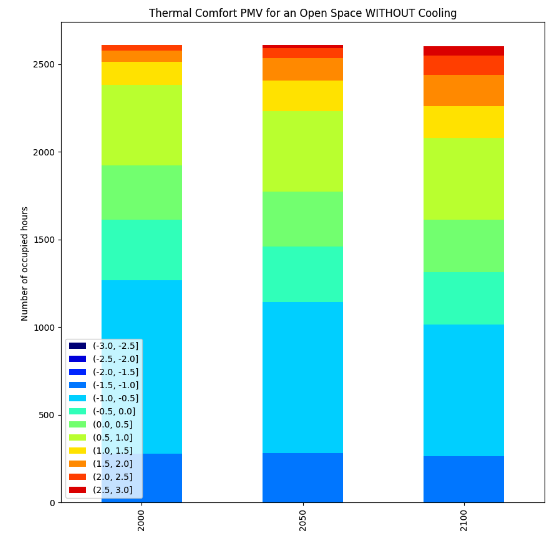
Well…the results demonstrate a big increase in overheating hours (PMV > 1), from 230 hours in 2000, to 380 hours (+65%) in 2050, ending with 525 hours in 2100 (+128%). In other words, it shows that manually cooling an office room (by opening the windows) is very likely to become impossible in the future, even in temperate climates.
3. Indoor Air Humidity and Temperature
Another way of measuring thermal comfort would be to measure the room’s relative humidity and temperature throughout the year. Relative humidity between 30% and 60% and a temperature between 21 and 26ºC are often considered comfortable for an office. Let’s plot the room relative humidity vs temperature for an open office space for 2000, 2050 and 2100 in a psychrometric chart. The green box you see represents the comfort zone whereas the crosses represent the interior air throughout the year.
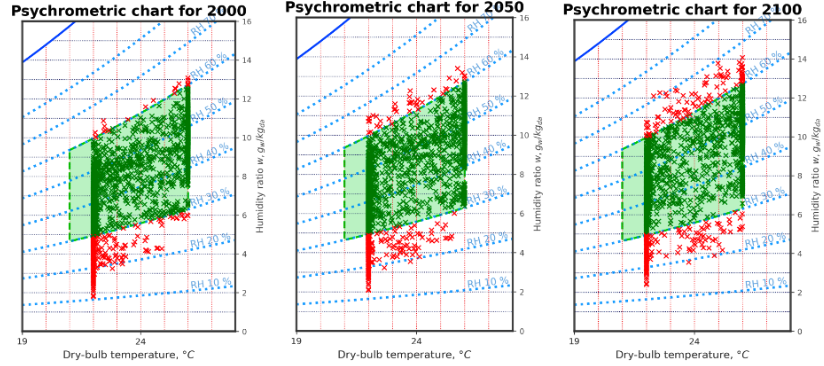
In this sense, we can see an upward shift in the relative humidity. Indoor comfort issues will very likely shift the winter dryness problems towards summer humidity problems.
4. Impact on Energy Consumption
To analyse the building behaviour from the point of view of the heating and cooling energy consumption, we’ll compare the building in Lyon in two other climates: in Oslo and Sevilla. The building fabric, especially the insulation thickness and the window thermal transmittance, have been adapted to the corresponding meteorology for giving more realistic results.
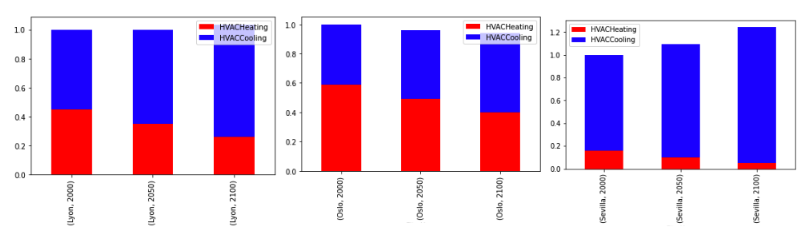
From the graphs, we can deduce that the cooling energy will increase while the heating energy will decrease in every case, which was foreseeable. An office building’s total energy consumption would decrease in cold regions (e.g. Oslo), or stay constant in temperate regions (e.g. Lyon), but will very likely increase significantly in hotter regions (e.g. Sevilla). Temperate regions where the focus is currently the heating energy consumption will slowly shift their attention towards cooling energy consumption. This may also bring the need for new energy efficiency measures for the built environment.
To sum up, in this article, we analysed office building behaviour for three scenarios: the years 2000, 2050 and 2100. The focus was put on the Indoor Air Quality, the Thermal Comfort felt by the occupants, the Indoor Air Temperature and Relative Humidity, and the Building HVAC Energy Consumption.
The results showed that the future could be a trade-off between higher energy consumption and a comfort decrease. This means that a general rethink of the way we plan, build and operate buildings will probably be needed.
As part of this plan, the constant monitoring and improvement of your buildings will become more and more important. In order to reduce the impact of climate change on your building, Dexma Detect will be useful to evaluate your building’s efficiency so that you can implement improvements.
In addition, our reporting tool can provide you with precious information about your energy consumption, in a form that you can understand easily and use as a basis for taking relevant and clear action toward greater energy efficiency. Learn more about Dexma Dashboards here. If you feel ready to embark on a new journey, or if you need more information, don’t hesitate to get in touch with our experts!
Editor’s note – This article has been written by a leading expert in energy management software:
 Johann Loux, Building Energy Modelling & Data Scientist Engineer, part of the Dexma Detect team since 2021. His objective is to improve Dexma’s AI algorithms through automated energy modelling of buildings. He also brings his expertise in the field of energy efficiency to the development of Dexma’s products.