It seems clear that many things have changed due to the pandemic phenomenon, including European energy consumption in stores, industries and offices. So, what if we analyse their behaviour before and after Covid-19 crisis? Go to the article and discover the 10 conclusions of the comparative study about pre and post covid consumption.
Purpose of the Energy Consumption Study before and after Covid-19
This March, it will be just one year since the first declaration of state of alarm due to Covid-19 in the UK and since then, many questions arose, such as:
In which sectors will consumption have been reduced the most? Will all countries have been affected equally? Which ones more than others? If a sector was closed, will it have 0 consumption?
So we thought, if we have a lot of information available in our database, why don’t we get down to work and start analysing?
The result is a comparative study on energy consumption.
The main purpose of this study is to understand how the COVID-19 pandemic has affected European industrial and tertiary buildings energy consumption.
Source and treatment of Energy Consumption data
Before having a glance at the results and to better understand why we obtained these results, it is worth explaining what data we used.
The data used for this study come from more than 80,000 buildings monitored by DEXMA across the 5 continents. For this particular study, we wanted to focus on the analysis of Europe first, dividing it into 4 regions:
- United Kingdom (Uk and Ireland),
- Nordic Countries (Denmark, Sweden),
- Southern European countries (Portugal, Spain, Italy, Greece and Croatia),
- And Central Europe (France, Belgium and the Netherlands).
On the other hand, the study includes only facilities that had consumption data from 2019 to 2020 (24 months) in order to be able to make meaningful comparisons and avoid extrapolations that could distort the results.
Also we wanted to go one step further and we segmented the results by type of activity, taking into consideration the following sectors:
- Office buildings,
- Health centers,
- Cultural and educational facilities (educational centers, universities, museums, libraries, etc),
- Stores, Supermarkets,
- Hospitality (restaurants and cafeterias) and Hotels,
- Sport centers,
- And Industries
Likewise, in the pre-processing of data, all the facilities that presented changes in their consumption profile or showed potentially anomalous or out-of-scale consumption data, were eliminated.
The data was processed in an aggregated and anonymised form, with the simple objective of understanding the impact of COVID-19 in different European sectors and regions.
The 10 Conclusions of the Study: The Impact of Covid on European Energy Consumption
1. United Kingdom is the most affected region with a 30% reduction in consumption
The first question we asked ourselves was: how the pandemic affected the different regions of Europe?
As we know, the impact of COVID-19 on the continent has been uneven. The virus spread has evolved differently and the measures taken by each administration have been adapted to the situation and context of each territory.
The following map show the annual impact on the consumption of each region:
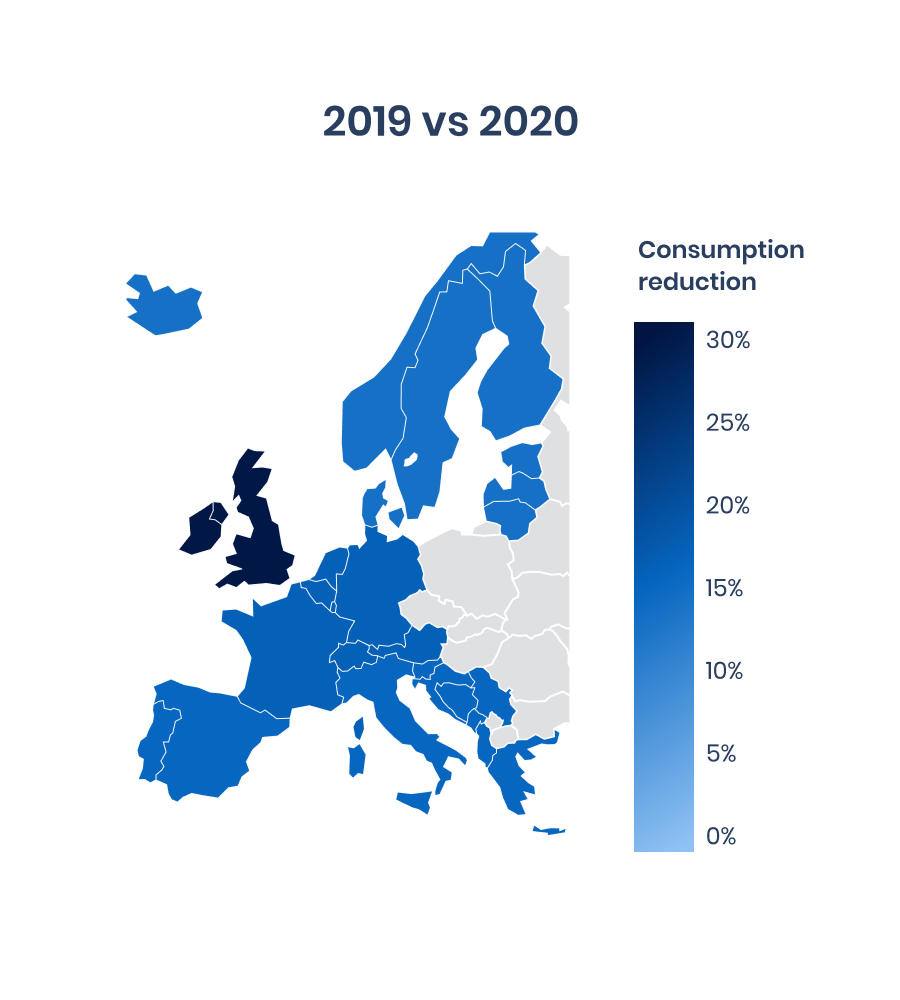
Source: DEXMA’S Database
With this information, we can answer the first question. And according to our study, if we focus on how annual consumption has varied in the different regions, we see that the results are similar for all regions except in the United Kingdom.
The region with the least reduction in consumption was the Nordic countries (8%), followed by Southern Europe (9%), and Central Europe (10%). In the case of the United Kingdom, we see a much higher impact, reaching 30%.
2. March, April, May and November 2020: the months with more difference in consumption in all regions
The change in electricity consumption has not been constant throughout the year. The pandemic situation has been evolving over the months in 2020 and the fact that governments have been reacting and taking measures in different ways obviously had an influence.
The following animation shows the impact according to the month of the year:
Source: DEXMA’S Database
Following the evolution of the results during the year we see that, as we already know, consumption in January and February were not affected by the pandemic. However, we find that during the following three months (March, April and May) there were large declines in consumption in all regions, with the largest decreases during April, coinciding with the first strict lockdowns and closure of commercial activities.
Let’s have a look at the results in more details. During March, the impact of the four regions was between 10 and 20%, with the UK being the least impacted. On the other hand, in the following three months (April, May and June), the impact of the United Kingdom was between 60 and 70%, a clear indication of the restrictions applied by its government.
On the contrary, Southern European countries and the Nordics had an impact on consumption around 20-30%, despite the implementation of measures and policies against COVID-19.
In parallel, the peak month that shows the highest impact in Central European countries was April, exceeding 40% reduction comparing 2020 with 2019.
3. Central European countries consumed more in August, September and October 2020 than during the same months in 2019
We find it curious to see how the countries of Central Europe not only recovered, but increased their consumption by 3 to 7% during August, September and October 2020, indicative of the recovery of productive and commercial activity. This trend is not followed by any of the other three European regions.
By the end of 2020, consumption drops again, but less sharply than during the first wave.
With the arrival of the European winter and the new variants of COVID-19, there is a rebound of cases, new virus waves requiring confinements and, therefore, reduction of commercial activity. In this case, we can see how the United Kingdom is once again the most affected region, with reductions of 50% in November and 40% in December.
In contrast, Southern European countries, probably due to less restrictive measures during the Christmas period, have a 7% impact in November and practically no difference in December’s consumption.

4. Central European Hospitals consume 24% more in 2020 than in 2019
Once we have reviewed the overall impact for each region, we can see how it has been distributed among the different sectors we analysed.
Let’s remember that the sectors we have selected are: Office buildings, health centers, cultural and educational facilities (Educational centers, universities, museums, libraries, etc.), stores, supermarkets, hospitality (Restaurants and cafeterias), hotels, sport centers and industries.
The following image provides a summary of how consumption has been affected in each sector for each of the regions we analysed:
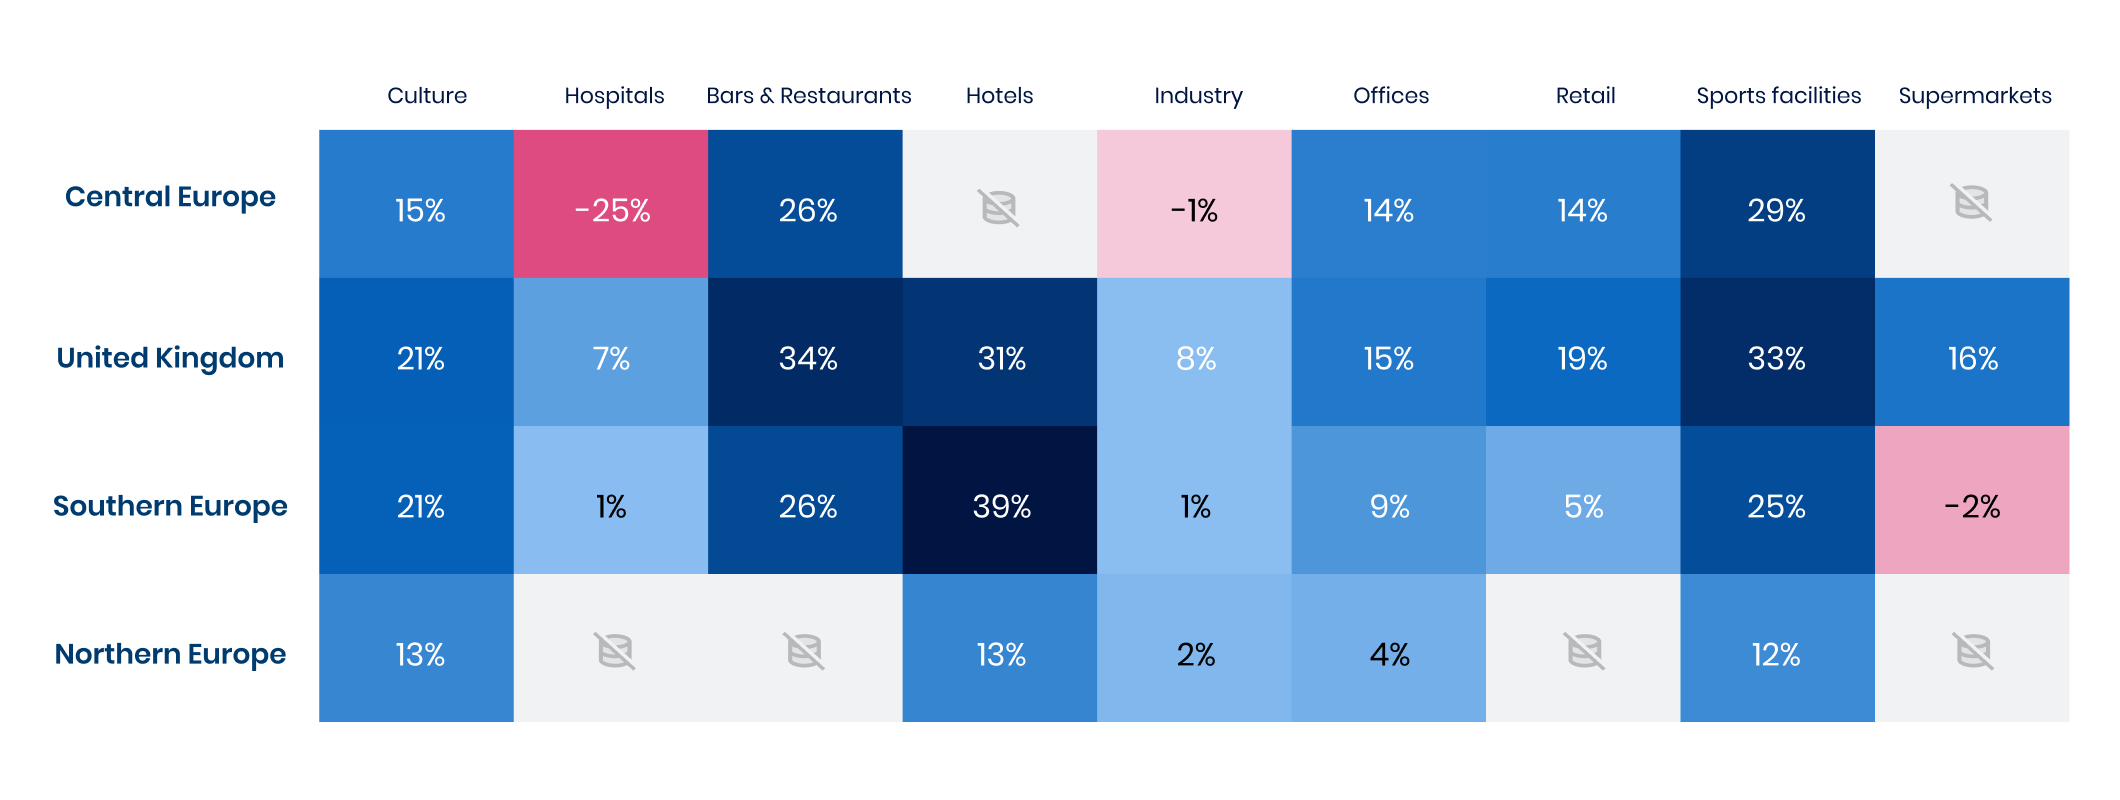
Source: DEXMA’s Database
If we were to think about which sector has been the most relevant during 2020, it would undoubtedly be the healthcare sector. The results show that, even though the activity in this type of centers has changed, consumption has shown small decreases or even increases.
This is the case in Central European countries, where energy consumption has rocketed by 25% during the year. If we look more closely at the Southern European region, we see that consumption has remained virtually unchanged. Lastly, in the United Kingdom, consumption fell by 7% compared to the previous year.
5. The HoReCa Sector (Hotels, restaurants and cafeterias), the most impacted with a reduction of almost 30%
The analysis by sector allows us to see how each of them has evolved during the health crisis. The case of the hotel and hospitality sector stands out. They have recorded their largest decreases in consumption: 28% and 29%, respectively.
In particular, we notice that the most affected hotels have been those in Southern Europe with a reduction of almost 40% in consumption. This does not surprise us if we take into account that these countries have an economy strongly related to tourism.
If we focus on hospitality, we observe that the major impact, in contrast, was in the United Kingdom with a 34% drop in energy consumption.
6. Despite remote work, Offices only Reduce Consumption by 11% on average
Undoubtedly, one of the key measures of 2020 has been the implementation of remote working. This could lead us to think that office consumption has experienced large drops, but according to the buildings we analysed in this study, it seems that it hasn’t been the case (comparing it with other sectors such as hotels or hospitality). This sector has shown a reduction in consumption of 11% compared to previous years.
Particularly striking is the case of the countries located in Northern Europe, where this reduction was only 4%. This could reflect the fact that these countries have already been integrating remote working and, therefore, the change has not been so abrupt.
7. People flow restrictions cause Europeans’ Sports Habits to change, and the sector has seen a drop in consumption of more than 25% in three of the regions
Another “protagonist” of this pandemic has been the change in people’s sports habits.
In almost every country there have been episodes of home lockdowns in which those who wanted to keep fit had to transform their homes into makeshift gyms.
On the other hand, after the lockdowns, we also saw how many people decided to get moving and go out in the street to do some workout.
These events have been direct consequences of the closure of sports centers, which has been reflected in their energy consumption, with decreases of close to 25%.
The region with the least impact was Northern Europe with a 12% reduction, almost three times less than the United Kingdom, which was the most affected area with a 33% drop in consumption.
8. European Industry, one of the least impacted sectors
Leaving healthcare centers aside, the least impacted sector has been the industrial sector, with practically no reduction in consumption. A significant drop of 8% in consumption has been detected only in the United Kingdom. The rest of the regions present changes of between -1% and 2% variations, which can be considered a normal difference from one year to the next.
9. Southern European Hotels have seen their consumption impacted by 73% during shutdown due to confinement
Let’s take a closer look at what happened in hotels before closing the businesses.
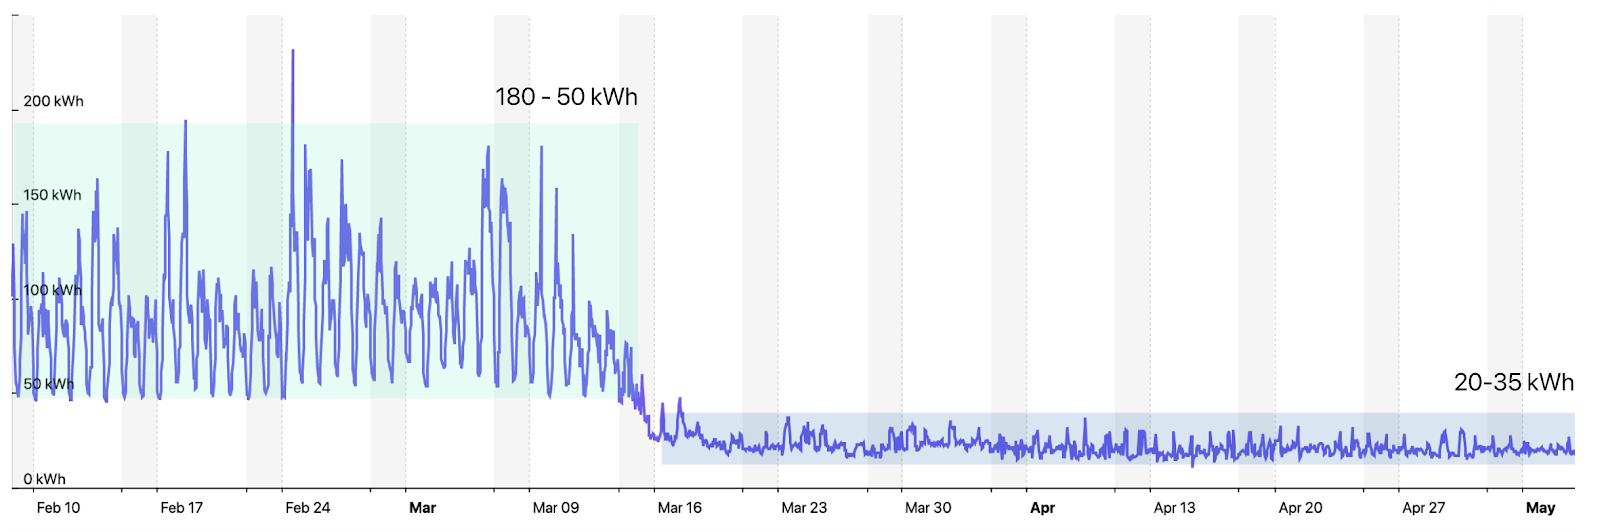
The following graph shows the hourly consumption of a hotel in the South of Europe. We notice that during the month of February and early March, its operating consumption is in a range between 50 kWh (night hours) and 180 kWh (peak hour).
As of March 15-23, coinciding with total lockdown (UK, France and Spain), electricity consumption decreases radically to values between 20kWh and 35kWh, as only the minimum loads have been left connected (mainly security and freezers).
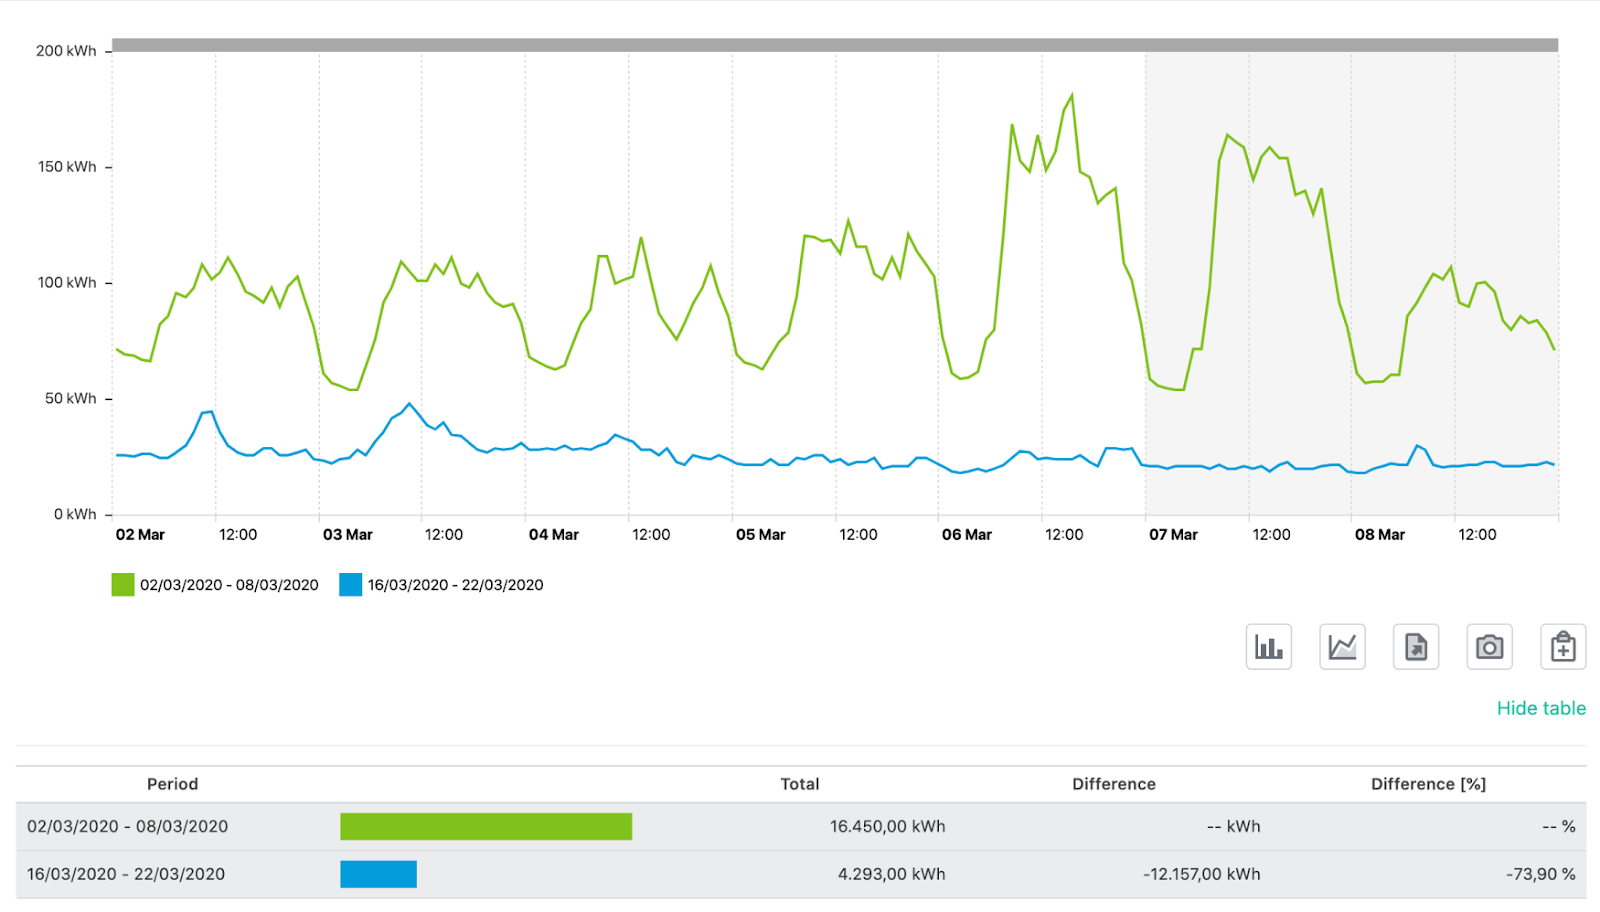
In fact, in the graph below, we can compare the week before confinement (in green) and just after (in blue), to see the 73.9% reduction in consumption:
Now let’s look at the summer period, when there was a relaxation of restrictions. Hotels were not allowed to operate at 100%, but at most they could accommodate between 50-70% of the customers.
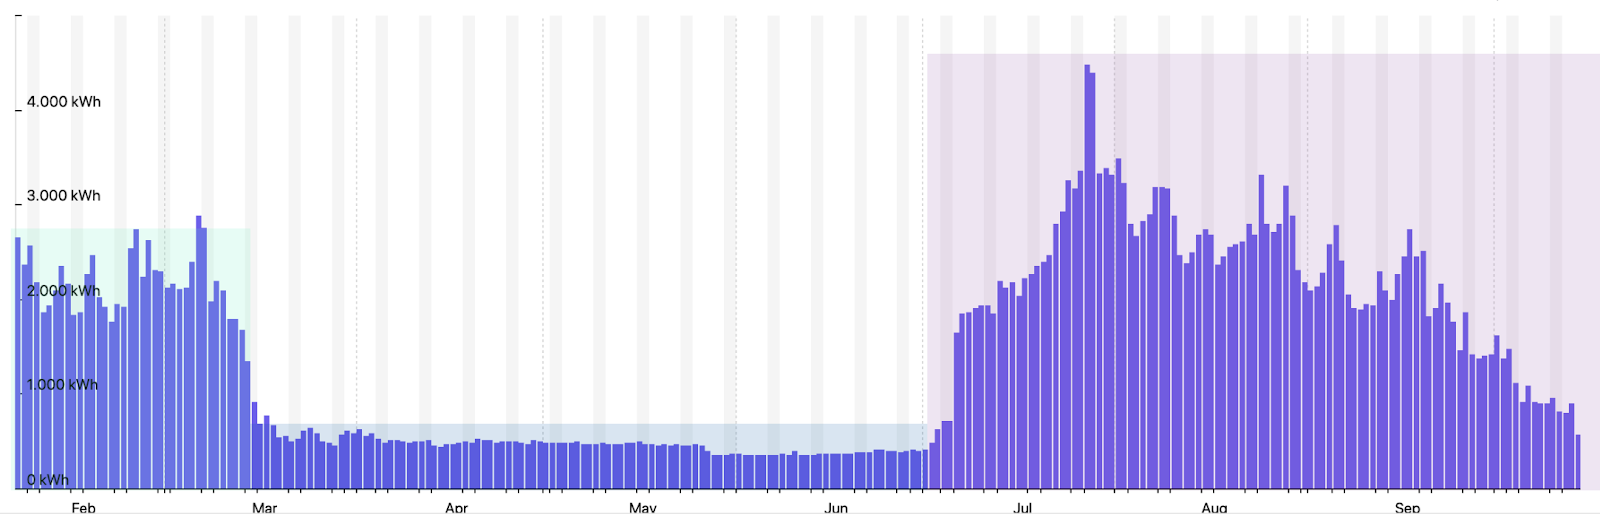
The following graph displays the daily consumption for a hotel in Southern Europe. We can see how consumption recovers, reaching more than 4,000 kWh/day.
But, although it seems that the consumption during summer was normal, if we compare August 2019 and 2020 through the following graph we will see that there is an impact of 28%.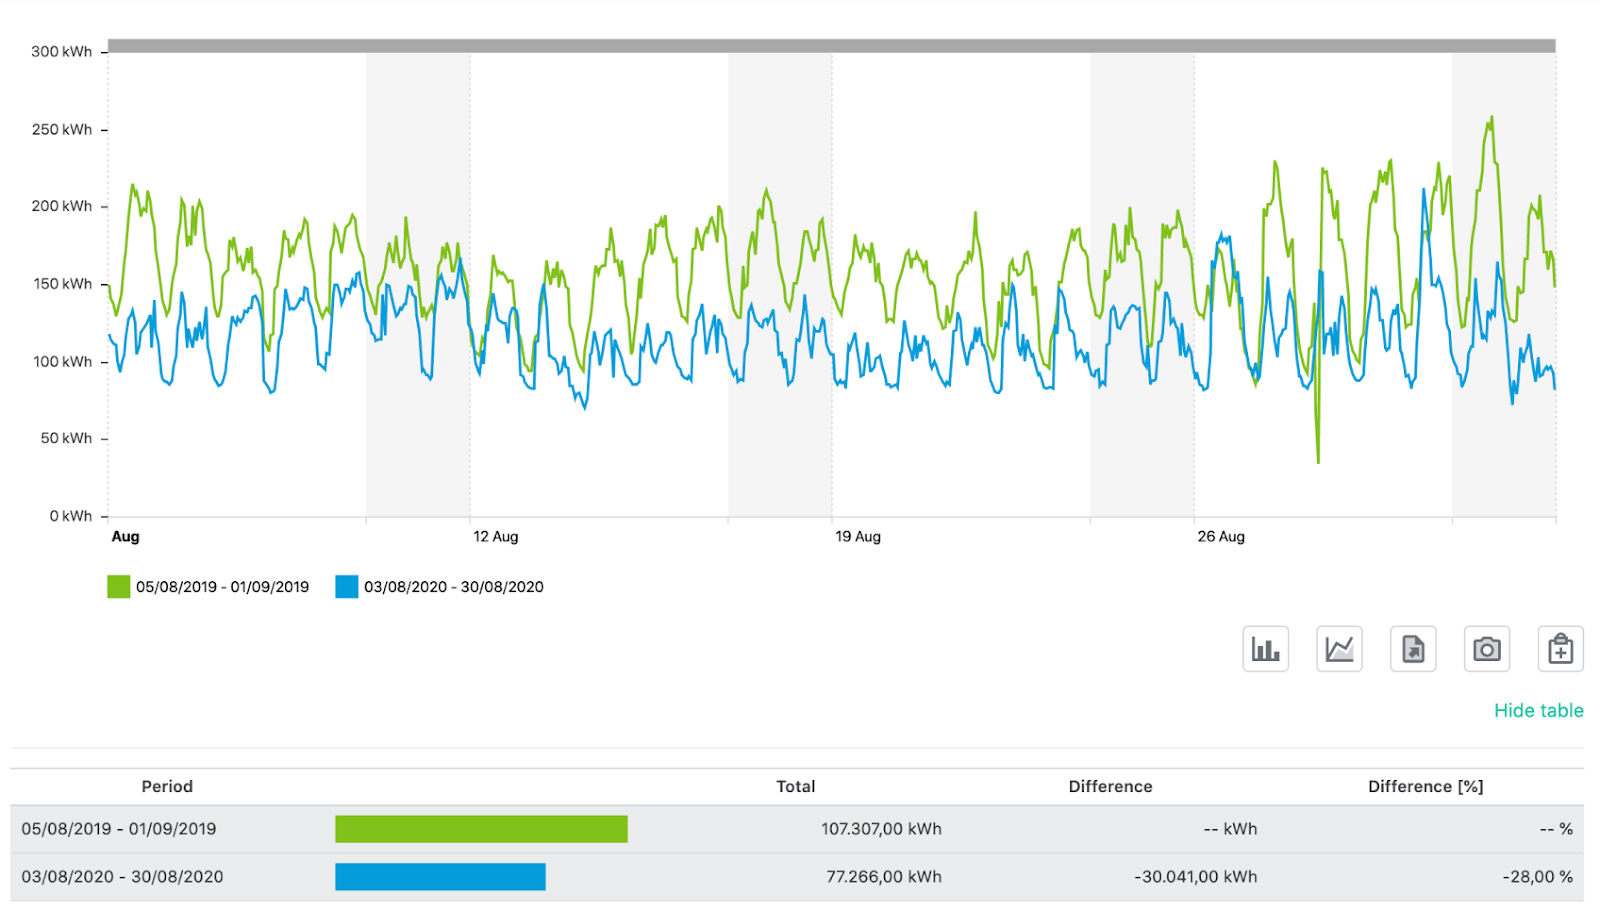
10. Supermarkets change consumption habits due to the curfew
We had a little surprise when analysing the data of some of the supermarkets, “before” and “after” the pandemic.
We know that retail is one of the less impacted sectors in terms of consumption. However, when going down to analyse the time patterns, we observe that the supermarket closes at 10:00 p.m., whereas before it used to close at 1:00 a.m.
Conclusion
As you have seen in the conclusions of the different cases we analysed, there are multiple variables that have influenced the reduction in energy consumption: from temporary shutdowns, to reductions of opening hours, of capacity and the restrictions on movement between geographical regions. All of them are due to both the measures taken by governments and changes in population behaviour as a result of the Covid-19 phenomenon.
We carried out this study at the European level and by sector, but a study like this one could also be carried out on a smaller scale or at a more corporate level.
For instance, a supermarket chain could analyse energy consumption data across all its stores, or a Real Estate company could study the impact on consumption across all the offices in its buildings portfolio, thanks to advanced analysis tools such as DEXMA Energy Intelligence. That way, they could draw conclusions that help to create new energy management strategies, reducing costs and improving the efficiency of their facilities. Here you can find, for example, a list of the most used Apps of the platform for advanced energy managers.
If you found this article interesting, share it on your social networks and subscribe to our blog to receive our next publications directly in your inbox.

Editor’s note – This article has been written by 2 of DEXMA’s leading experts in energy management software:

Juan José Vázquez, Data Scientist & Machine Learning Engineer, is part of the DEXMA Product team since 2019. He is in charge of getting the most out of the data platform, improving current tools and launching new features based on Artificial Intelligence.
 Daniel Utges, Product Director at DEXMA, has been part of the team since 2010. His journey at DEXMA started as a Product Engineer, then Customer Service Manager, before he became Product Director in 2013. We can say that he knows the DEXMA Platform from A to Z.