Whether you are currently implementing an energy-saving and efficient project or you are planning to start in the coming weeks, you will be interested to know how you can adjust your baselines taking into account the impact of Covid-19. We give you the keys below:
Adjusting your baselines is important in order to be able to correctly report the savings achieved, in case you have to share them or if they are guaranteed in your CRE contract.
During the Covid-19 Lockdown period, many of the static variables of the buildings were modified, such as the operating hours, the occupancy of the sites, the opening area (as in the case of shops), the level of ventilation of the sites, etc.
In most centres, which unfortunately had to close or reduce their activity, consumption was reduced to a greater or lesser extent. In other centres, on the other hand, activity increased, such as those related to care activities, for example.
What is almost certain is that the Covid-19 period affected your building’s consumption in one way or another, and the impact of this variation in consumption makes monitoring the savings from your energy efficiency projects more complicated.
To help you avoid the impact of Covid-19 on your current and future savings calculations, here are some tips you can follow.
Let’s start by explaining two basic concepts: EPC and Energy Baseline.
What is an Energy Performance Contract (EPC)
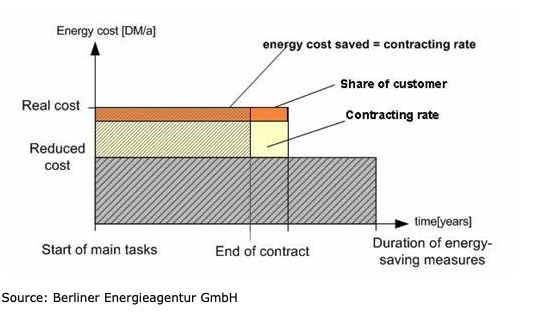 An Energy Performance Contract (EPC) is an agreement between two companies. Company A has a non-efficient facility (i.e. an office building) and wants to become more efficient but has no budget. Company B agrees to finance the necessary energy efficiency retrofits (i.e. an HVAC revamping) in exchange for sharing the savings achieved by this retrofit in the facility. Company A and Company B sign an EPC contract to execute the retrofits.
It is a win-win situation, as company A becomes more sustainable without financial risks and company B gets a margin on top of the investment. Savings can be shared in different ways, from 50-50% to 20-80%, depending on the financing amount and conditions.
Savings are validated and verified comparing the real facility consumption to the facility baseline, calculated from historical data.

What is a baseline
A baseline is the holy grail of energy efficiency projects. It is basically a statistical energy model of how a facility (i.e. a supermarket) should be consuming today if no energy efficiency retrofits were executed.
The idea is powerful. If I can estimate how much energy I should be consuming today, then I can compare this to the current energy that is consumed and the gap will represent the savings.

Where:
- Baseline period: 12 – 36 months taken as historical data
- Reporting period: Period of time where the savings are evaluated. Agreed in the EPC contract. Normally from 12 to 60 months.
- ECM: Energy Conservative Measure is executed and the facility becomes more efficient
- Reporting period measured energy: Measures from bills or real-time energy monitoring
- Savings: Amount of energy not consumed.
Seems like calculating a baseline is simple, right? Well, a baseline is built using historical data, normally from 12 to 36 months. Facility conditions change a lot over 3 years (i.e. weather can be warmer from one year to another), or activity can change, or a pandemic can force you to close the building for a particular period of time or reduce the number of users, thus the energy consumption, for long periods.
This is why the baseline statistical model should include the parameters that correlate with the facility’s energy consumption, if we can measure them, such as external temperature and occupancy levels.
A baseline normally takes some days/weeks to get adjusted and calculated if you use simple tools such as Excel. If you want to properly adjust your baseline like a pro in a cost-effective way, you can use the Automatic Baseline Calculator (ABC) available on DEXMA Analyse, as I will show you later on.
There is even a protocol to calculate baselines, called International Performance Measurement and Verification Protocol (IPMVP)
[Case 1] How to calculate the savings of an Energy Conservation Measure (ECM) by making an adjustment to the baseline during the Covid-19 lockdown period.
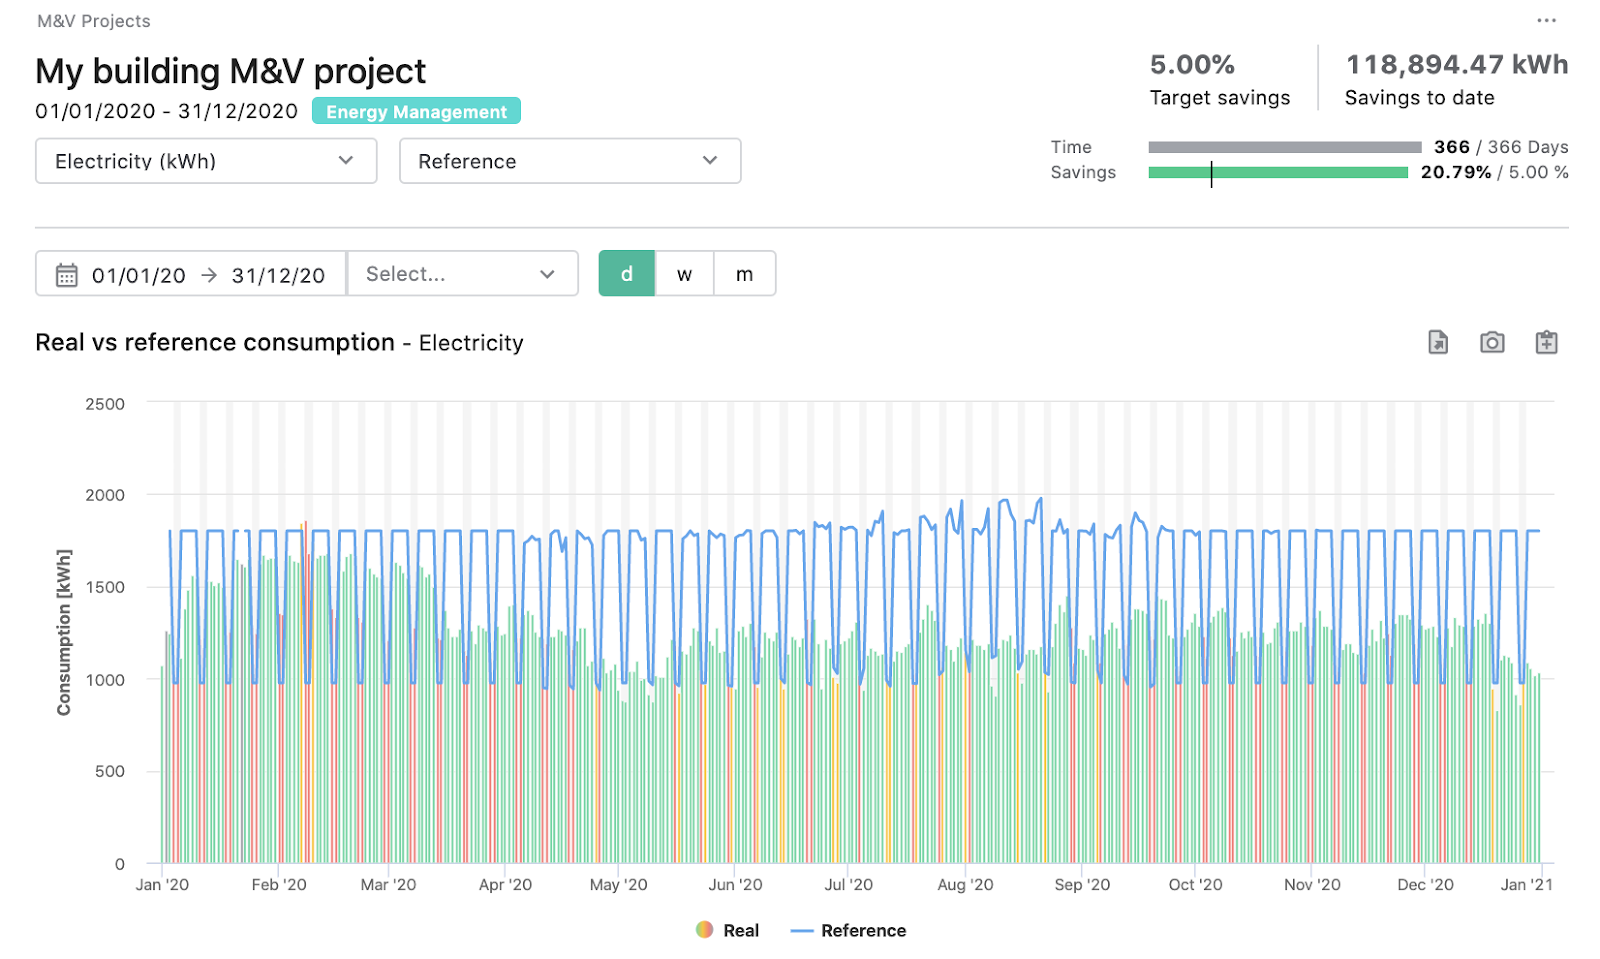
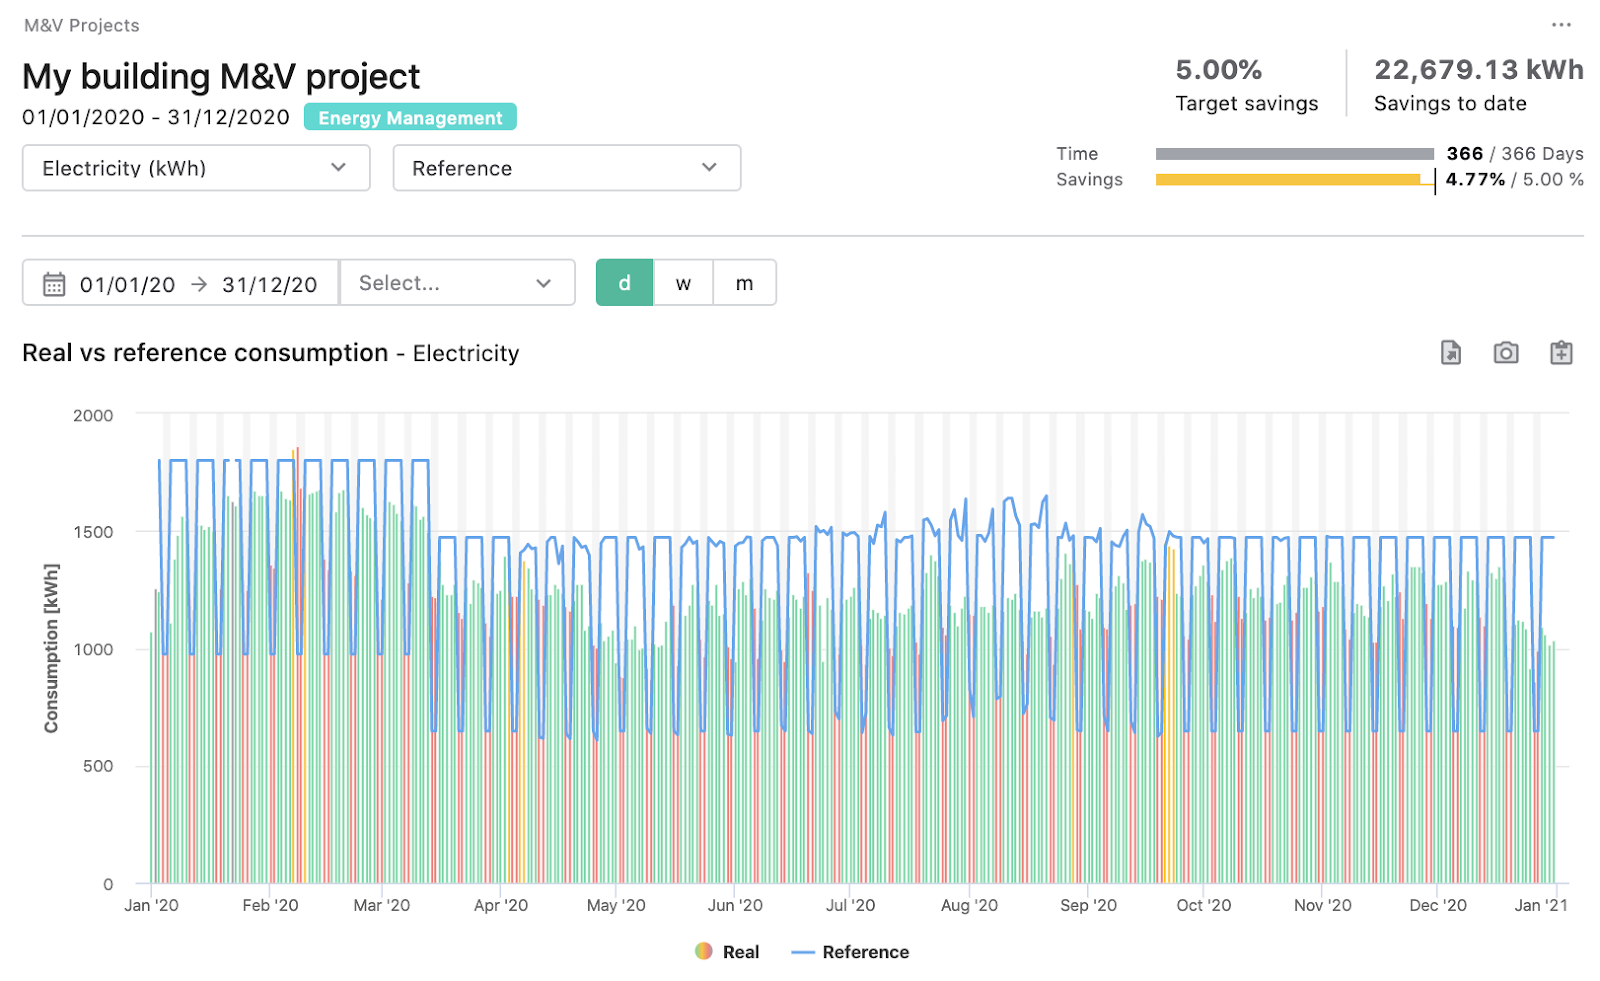
If you look at the example below, you can see how the building’s consumption drops significantly from March 14th, when the pandemic starts.
The savings that had been reported until then due to efficiency measures were around 4-5%, but the drop in consumption due to Covid-19 results in a “measured saving” at the end of the year of 20.79%.
Assessing the reduction in consumption due to Covid-19 can be complicated, and to do so we need to consider whether the savings from energy efficiency measures have been affected by Covid-19. If we know how to estimate the impact, we can adjust our baseline using a non-routine adjustment.
SIf the savings from energy efficiency measures are independent of the site’s consumption, e.g. because of changes in luminaires that have remained on despite reduced activity, we could estimate the average consumption reduction with tools such as DEXMA’s Evolution screen, and apply this adjustment to our Measurement and Verification (M&V) project.
To do this, we simply select our consumption meter, 1-month time window in daily frequency for one month previous to the pandemic (February) and the three months after (March, April and May).
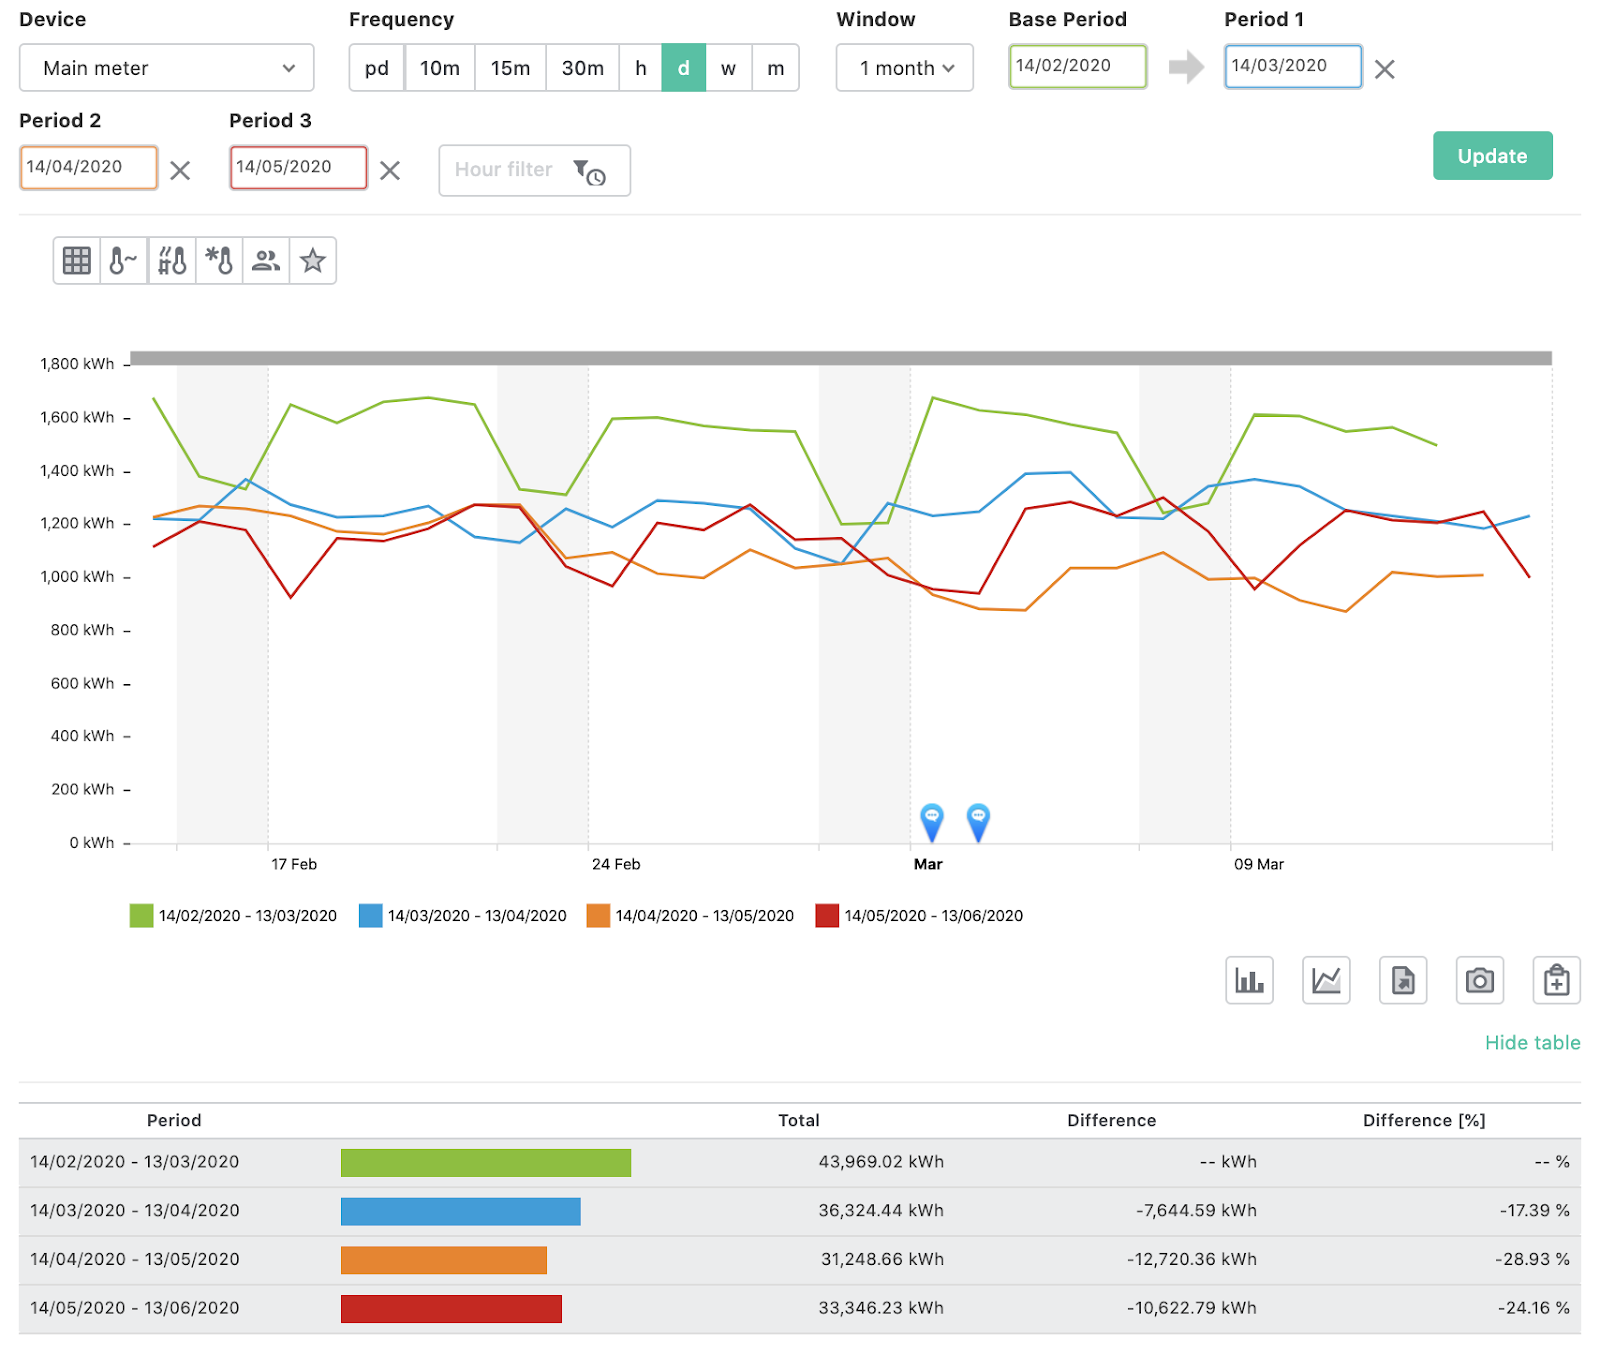
If we calculate the average monthly consumption reduction in the pandemic months compared to the pre-pandemic consumption, we get a monthly average reduction of 10,329 kWh, which divided by 90 days equals approximately 344.30 kWh per day.
Now we simply need to reduce our baseline in the Metering and Verification project by 344.3 kWh per day as of 14 March 2020. We can do this by editing the M&V project and adding a “Non-routine” setting, as seen in the following image.
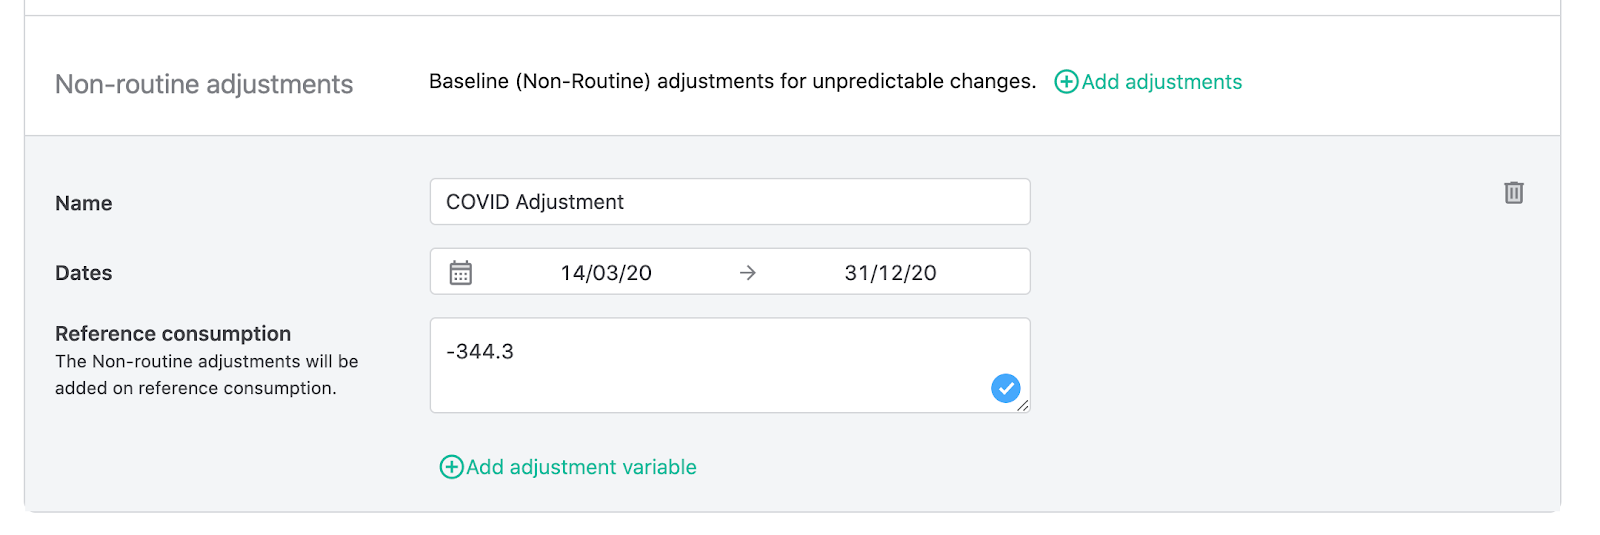
The non-routine adjustment allows the baseline to be reduced (or increased) by a known amount (this can be a fixed number or a formula) to correct the measured savings. In this case, with an adjustment of 344.30 kWh per day over the baseline, we observe that the reported savings in 2020 drop from the previous 20.79% to 3.82%.

To further refine our result, we can calculate the difference in consumption for the same months of the previous year, when there was no Covid-19, and subtract it from the adjustment applied this year to take into account the normal decrease in consumption during the months without the pandemic.
We repeat the previous exercise in the DEXMA Evolution screen, but now selecting the months of February, March, April and May 2019, to see the natural trend of the building.
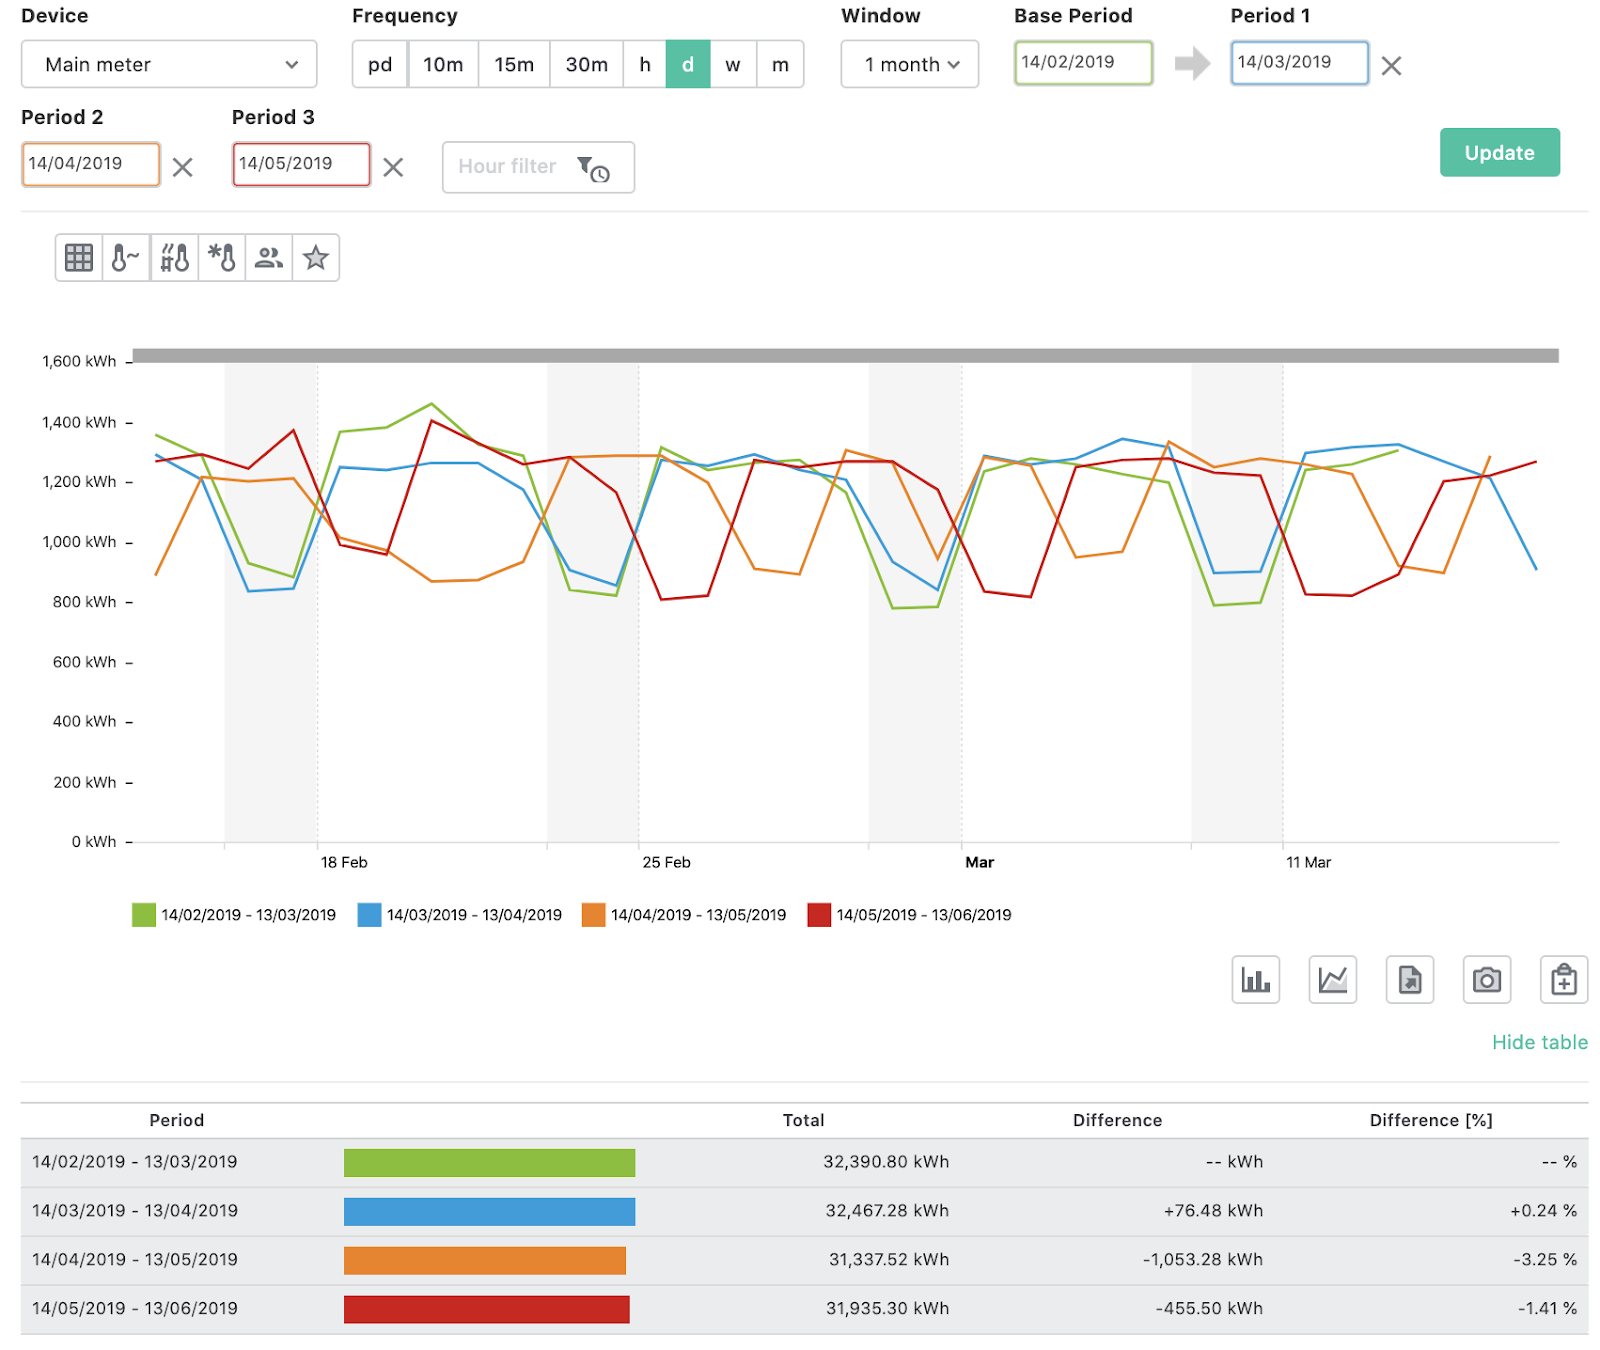
If we add the monthly differences (76.48 -1053.28 -455.5 kWh) and divide them by 90 days, we get a natural reduction of -15.91 kWh per day. Although this is a low reduction (only -15.91 kWh per day compared to -344.30kWh in 2020), if we reduce the Covid-19 adjustment by 15.91 kWh per day and leave it at an adjustment of 328.38 kWh per day the project savings result in 4.77%, which is closer to the pre-pandemic savings figures.
The important thing, in this case, is to make sure that the savings from the efficiency measures are not affected by the reduction in building consumption so that the adjustment does not affect the savings calculation.
[Case 2] How to calculate the savings of an ECM avoiding the Covid-19 lockdown period
Another possibility would be that the energy efficiency measure could not have been applied during the confinement, or we want to avoid this period in the analysis in order to not distort the calculation. In this case, we would only want to measure savings during certain periods.
If, for example, we know that the activity has been affected in certain specific periods, we can review the savings for the periods in which we consider that the savings have not been affected. To do this, once we have our Measurement and Verification project set up, we can select a specific time range using the date selector. Let’s look at an example:
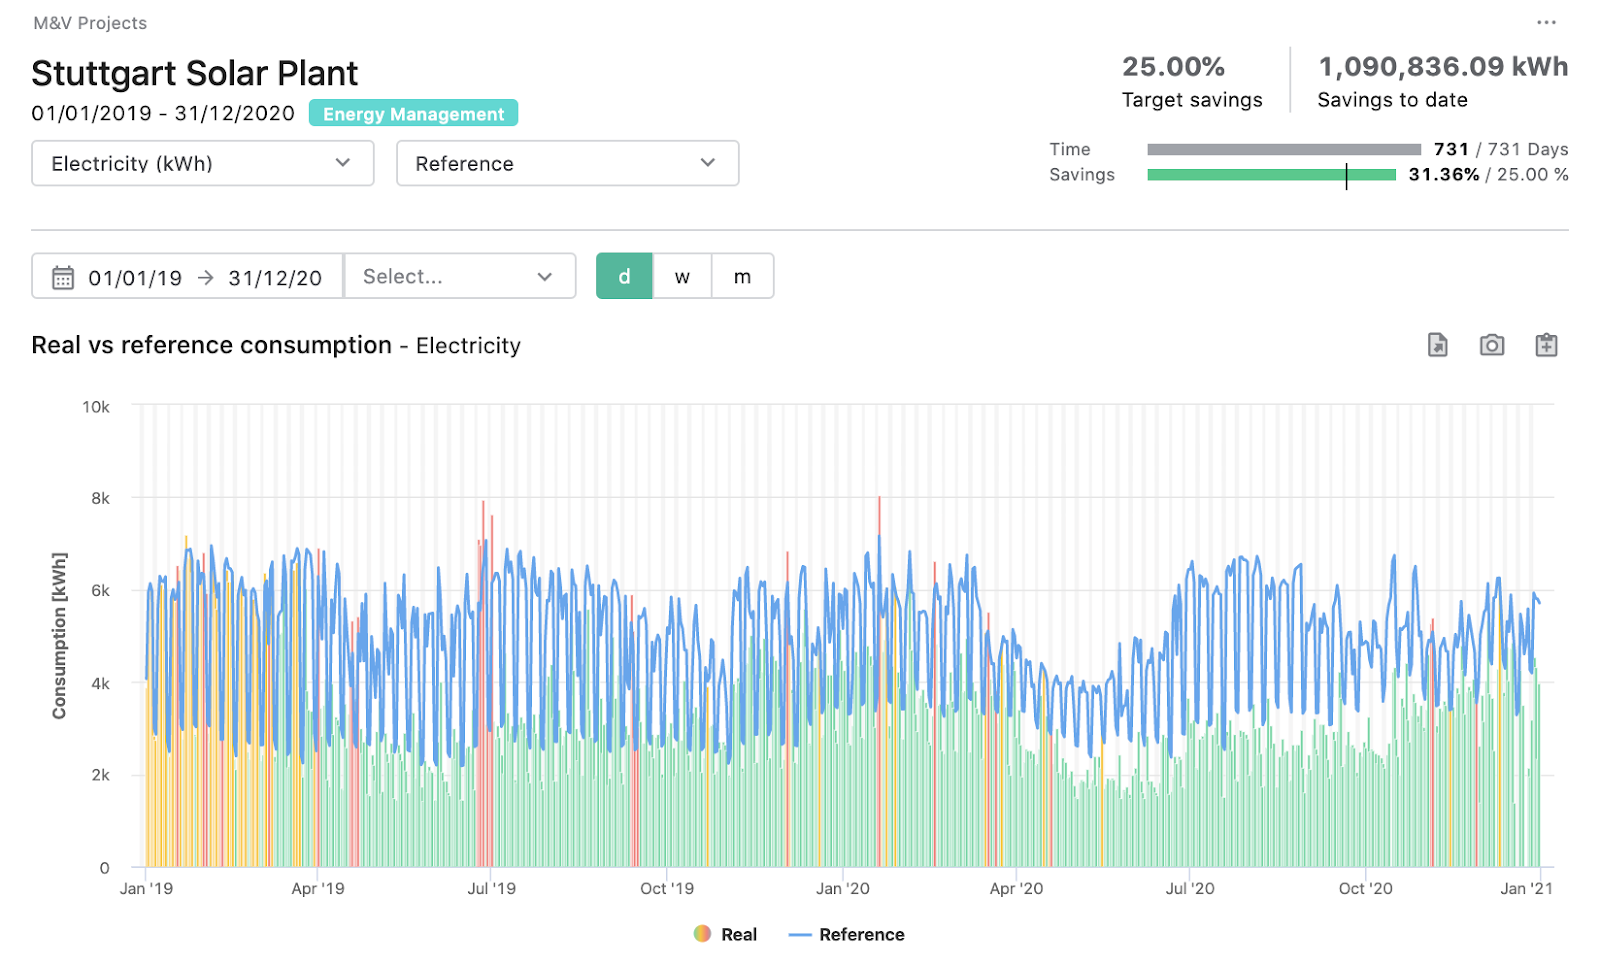
The example above is the consumption of a corporate building with a PV self-consumption system. An initial phase of almost three months can be observed in which the savings are almost zero, as the measurement was inactive for technical reasons.
However, after the pandemic, in April 2020, we can see that the savings increase abruptly due to the decrease in consumption.
The total measured savings figure is 31.36%, but both of these periods affect this figure, so we do not want to rely on it. We reduce the time window to the period when the PV system was operating without the selected pandemic from 26/03/2019 to 13/03/2020.
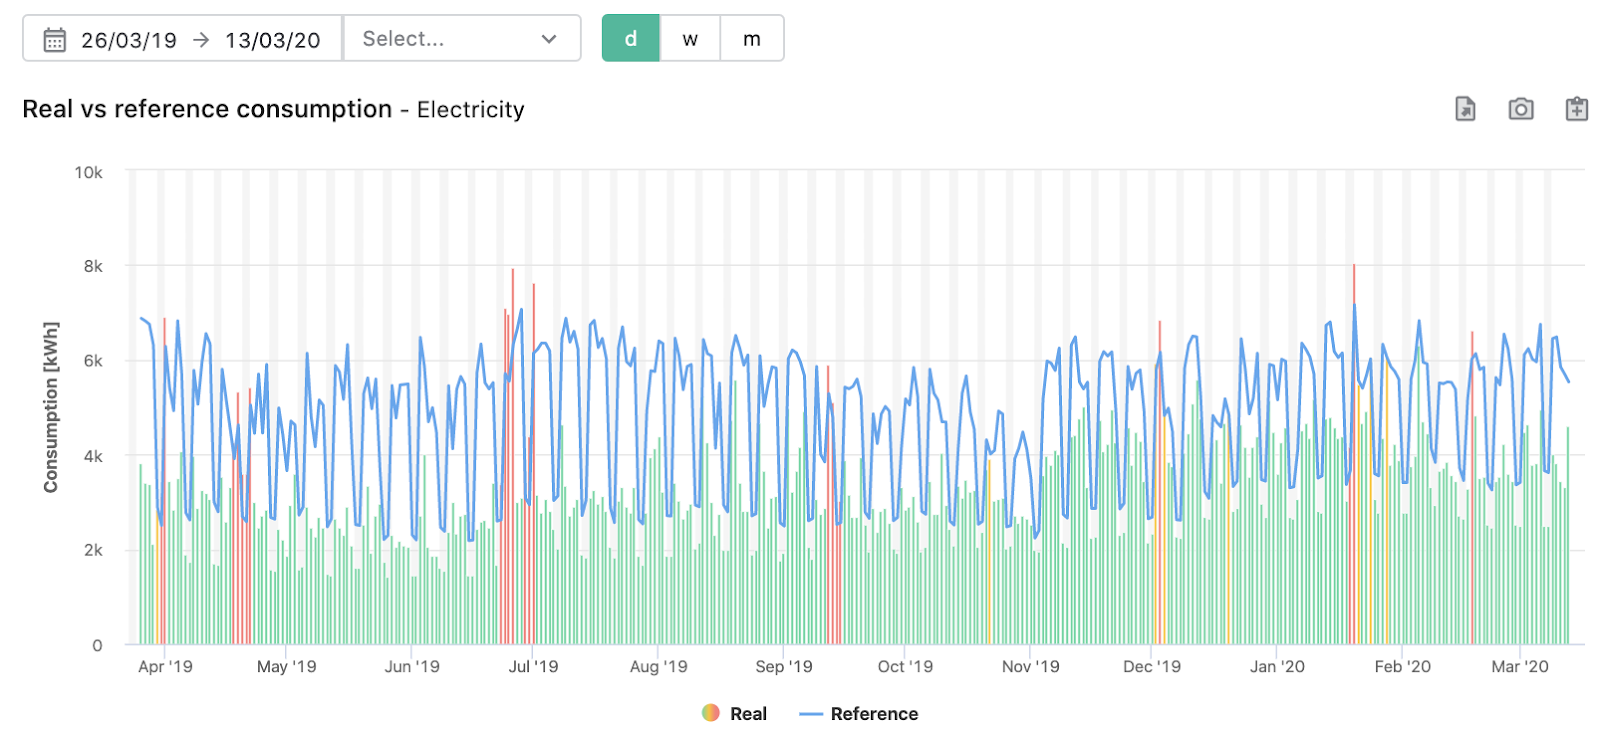
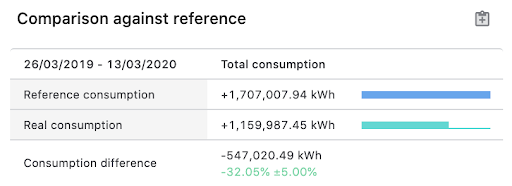
If we carry out the analysis selecting the dates between the activation of the measurement and the start of the pandemic, the analysis gives the result of a total saving of 32.05%, very close to the previous figure (since the periods of overconsumption and Covid-19 savings happen to cancel each other out). We know that this figure is not affected by exceptional periods, so we can take it as a good average saving for the project.
[Case 3] How to calculate Baselines with DEXMA avoiding Covid-19 lockdown period
Let’s suppose that we want to apply a new Energy Conservation Measure (ECM) after Covid-19. We simply have to calculate a baseline avoiding the Covid-19 effect… but how? It is very easy.
If the site’s activity outside the confinement periods can be considered normal, what can be done is to just remove the Covid-19 periods (e.g. weeks of total confinement) in the baseline calculation, thus using “Covid-19 clean” data for the baseline reference.
To calculate professional baselines in a few minutes, access the Automatic Baseline Calculator (ABC) functionality in your DEXMA account. If you don’t have it, you can install it for free in the Apps Market.
- Option 1: Use historical data from 2020 removing the Covid-19 impact weeks.
Once in the ABC functionality, we select the device on which we want to do the baseline and the variables that can affect consumption (outside temperature, degrees day, etc.). Remember that if you want you can use virtual temperature probes to obtain climate data quickly without having to mess with other websites to download data and upload them to DEXMA.
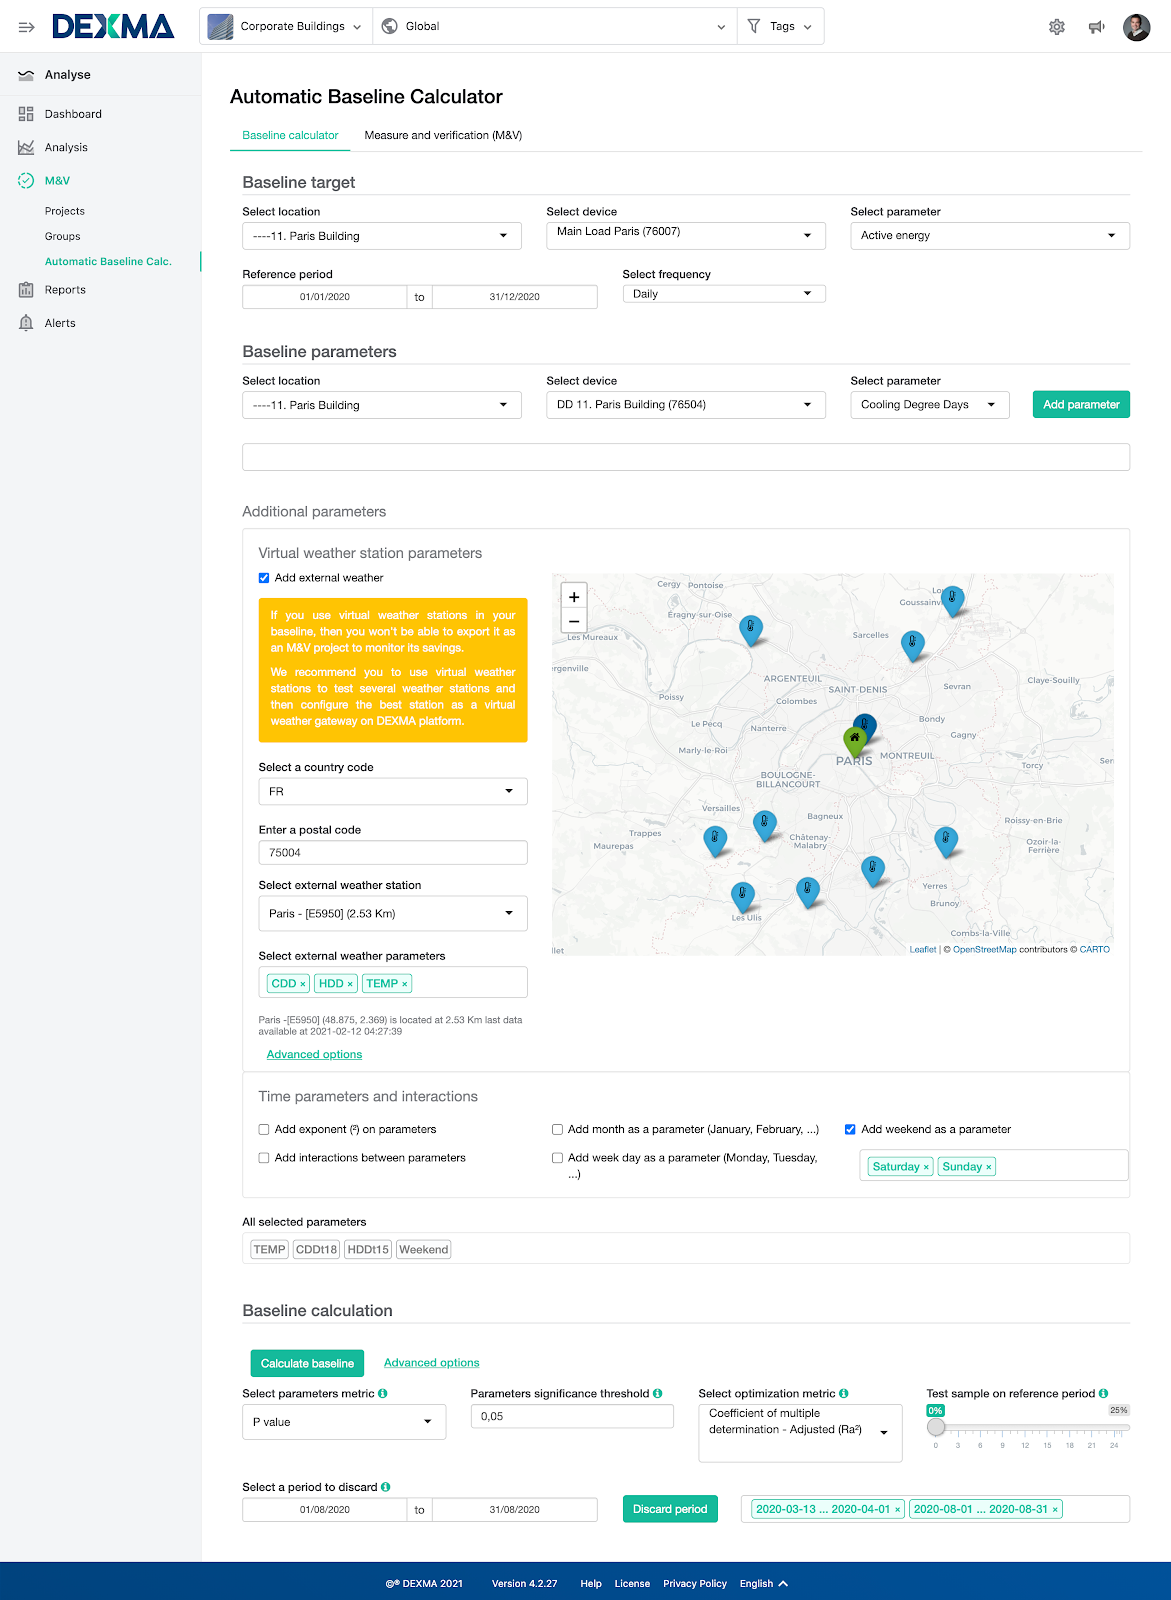
Now comes the important part. In the Baseline Calculation section, click on “Advanced options” and an option to discard periods will appear. As we can see in the example below, we can select more than one time period. Add as many periods as you need to “clean” your data as much as possible. In the example, we have discarded from 13 March to 1 April and from 1 to 31 August 2020.

Now we simply click on “Calculate baseline” and wait a few seconds for DEXMA to find the optimal polynomial that best correlates with our consumption. We can observe the baseline result (the mathematical formula that models our consumption) inside the black box.
- Option 2: Use historical data before 2020
If sufficient historical data is available, it is best to use a reference period of several years before, but also to take into account the year 2020 without the lockdown periods, so that the evolution of consumption is reflected in the baseline without these periods.
On the other hand, given the uncertainty about the near future, we can also calculate in addition to the baseline above, a baseline on the lockdown period to apply in case of new confinements.
For example, if the efficiency measurement was performed during summer 2020, we may be interested in evaluating the consumption of the second confinement (October-December) against the baseline made from the first confinement.
That way, we can apply each baseline (with or without confinement) to the period we are interested in, having a better reflection of the situation before and after the ECM.
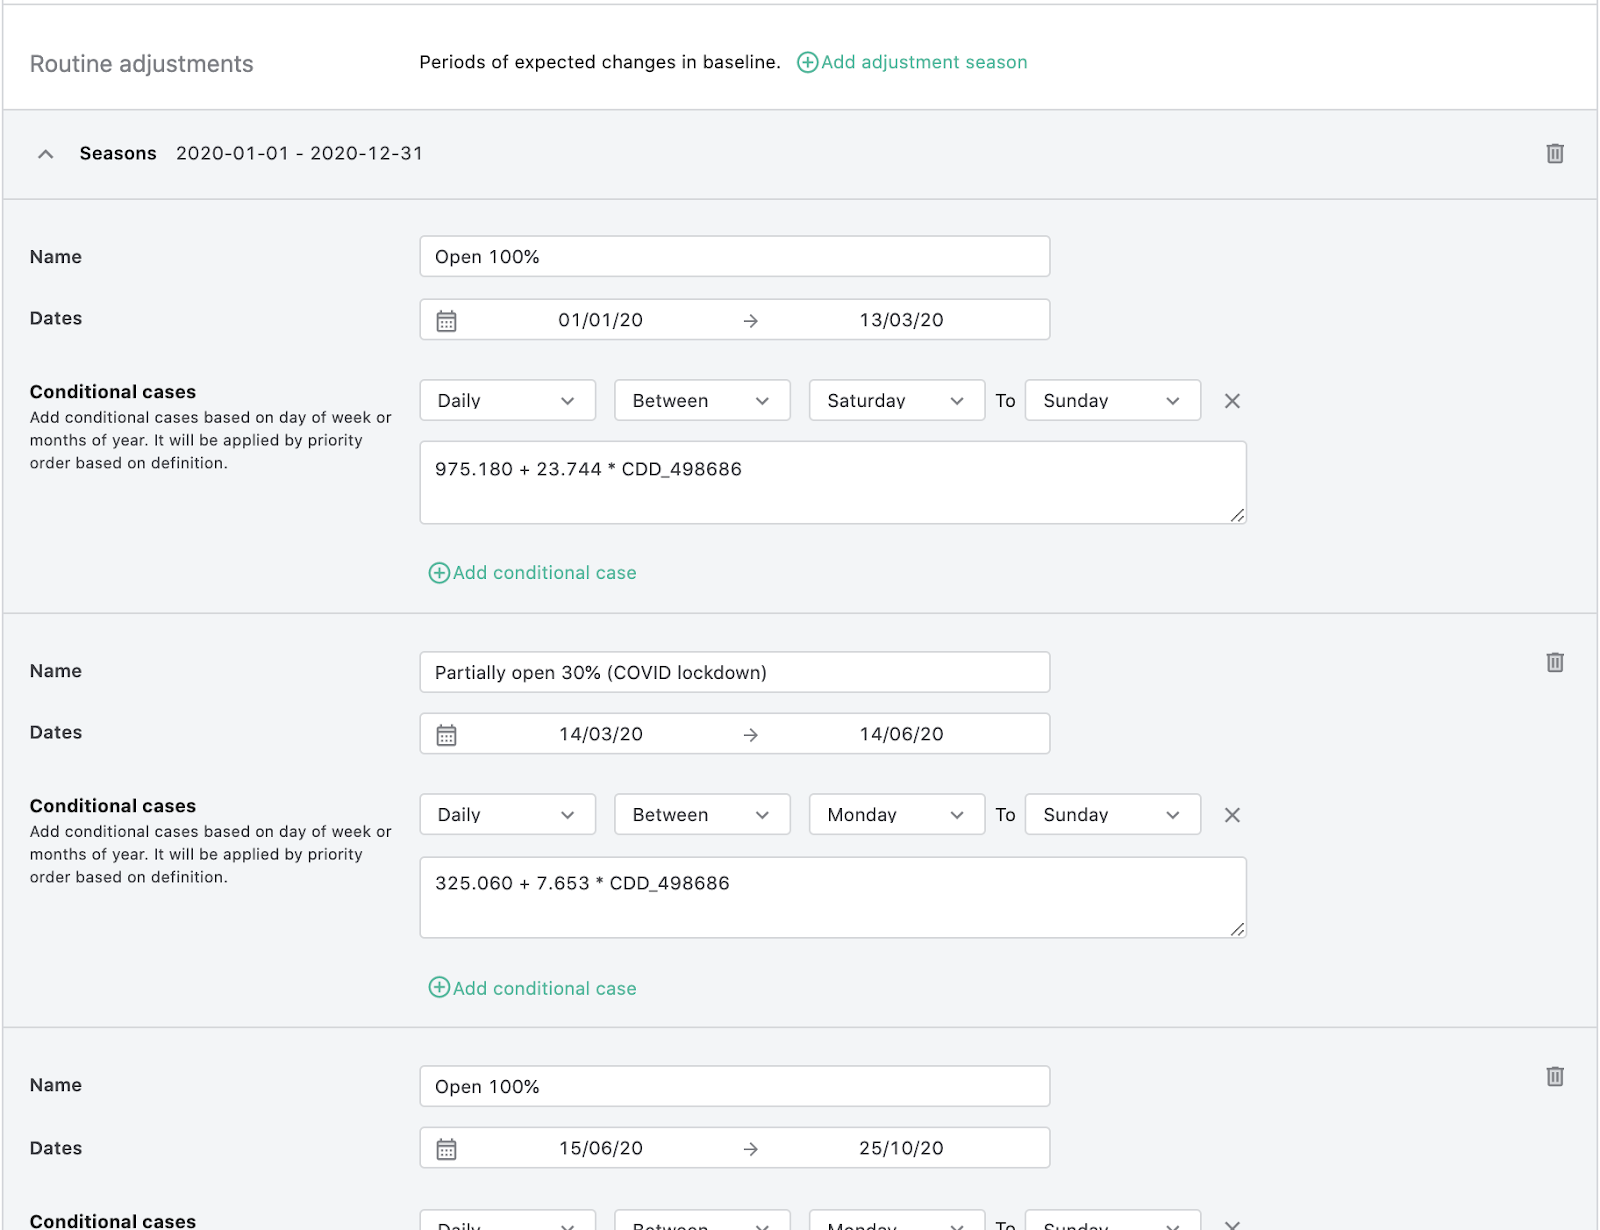
This can be done thanks to the M&V routine adjustments in Analyse, which allow you to define a different baseline for each season in your analysis.
[Case 4] How to calculate Baselines with ABC including the Covid-19 lockdown period
In the case where it is necessary to include the Covid-19 period in the reference period because for example there is no more consumption history to use for the baseline calculation, the recommendation is to use for the baseline calculation as many variables as possible that can affect the consumption in the confinement period.
Variables that in other times used to be considered static, such as operating hours, occupancy of the centres, opening area, or the ventilation level of the centres, in this case, it is advisable to include them as baseline variables, thus being able to make the regression thanks to this information.
The data of production, occupancy, schedules, surfaces, or ventilation flow rates (if you have a building management system) for example, or other variables of interest, can be uploaded to the DEXMA Analyse platform as variables, which can be numerical or binary (open/closed, for example) and selected in the Automatic Baseline Calculator (ABC) functionality so that they are taken into account in the Baseline calculation.
In this way, the Baseline will respond to all the variables that influence consumption and can be evaluated when those variables change, such as the percentage of open area in a shop, or the required ventilation levels. This will give a more detailed and accurate model of the behaviour of the building in response to these changes.
It should be remembered, however, that the model will then need to be fed with these variables throughout the savings measurement period to be able to assess the baseline correctly.
In any case, the most suitable method to apply to each project will be different and will depend very much on the activity of the centre and how it has been affected by this damned pandemic. If you have any doubts about how to calculate your baselines or verify savings in your measurement and verification projects, you can contact the DEXMA team at support@dexma.com, and we will try to help you.
And if you want, you can access DEXMA Energy Intelligence Demo, and try, our automatic baseline calculator (ABC), among many other functionalities.
Editor’s note – This article has been written by 2 of DEXMA’s leading experts in energy management software:

Alfonso Mateos, Product Owner at DEXMA, has been part of the team since 2015. He started his career at DEXMA within the Operations Department, supporting both hardware and software customers thanks to his excellent background as energy projects manager. He currently works in the Product Department as Product Owner of the most analytical part of the DEXMA Energy Intelligence Platform, DEXMA Analyse.
 Daniel Utges, Product Director at DEXMA, has been part of the team since 2010. His journey at DEXMA started as a Product Engineer, then Customer Service Manager, before he became Product Director in 2013. We can say that he knows the DEXMA Platform from A to Z.