As the digital transformation of energy gains momentum, energy managers are being bombarded with a growing data deluge.
In fact, some of the most common questions we get from new DEXMA Partners include “What report should I be viewing?” and “What energy data matters most?”
Even though you might be working with a wide range of clients from different industrial sectors, there are certain energy consumption metrics that every energy manager should be looking at.
After all, badly configured or ignored metrics will negatively impact your client’s cost estimates or retrofit project plans, so it’s important to nip any potential discrepancies in the bud.
If one of the following analytics doesn’t look quite right, it’s a clear signal that something needs to be tweaked or changed altogether:

1. Compare Energy Bill Charges vs Monitored Monthly Energy Consumption
Track down your energy bills from at least 6 months prior and compare the charges with your monthly consumption to see if it is the numbers match up. This is a good place to start when checking for basic red flags, like whether your energy metering system is set up correctly.
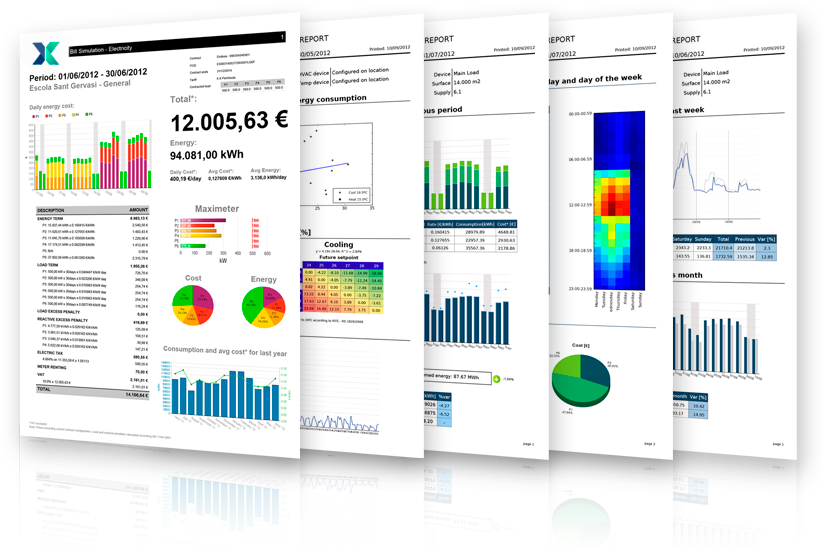
Pro-tip: Did you also know you can also create a simulated electricity bill for your facility, even before the real one arrives?
2. Weekly Energy Consumption (kWh)
While many energy managers focus on monitoring monthly energy consumption (which is only natural as that’s what shows up on your bill each month) a savvy energy manager will check weekly energy consumption as well. It can take time to see an improvement in energy performance, but this weekly analysis offers a quick overview of your client’s installation instead of having to wait for a monthly report.
If you are using DEXMA, you can find this information in your weekly basic energy report. You will also get energy consumption and cost summary tables for each reported week, organised by weekday. Try to check the last columns showing the aggregate consumption and cost for the whole week and compare them with the previous ones, to see if there is any variation.
3. Energy Cost to Energy Consumption Ratio in a given period (€/kWh)
The cost vs consumption report gives you a deeper analysis of one of the most important factors in an energy efficiency project: how much your energy consumption is costing you.
If you are using DEXMA, these metrics come in a double-sided report, analysing the cost by tariff time bands. Pay attention to the ratios showing average cost per kWh consumed, daily average cost, etc. The average price per kWh is especially useful to make further analyses and reports or to quickly quantify the ROI of potential energy efficiency projects or energy conservation measures (ECM).
Also, check the consumption versus cost analysis pie charts for a more visual representation of how different tariff time bands affect your energy costs.
This metric can also help you decide whether you should shift your consumption to a cheaper period (via load shifting or demand response) if your client’s installation allows for it.

4. Predicting Consumption and Cost
Calculate a future forecast of energy costs and consumption is the dream of most energy managers. Thanks to artificial intelligence you will be able to predict energy consumption and costs with tools like the Forecasting App.It also compares this with different budgets and baselines as defined in DEXMA.
The first thing you need to do is set up your forecast to allow the system to make certain baseline calculations using time series algorithms. Once everything is set up, wait a few minutes. The mathematical calculation improves after a few weeks and gets more and more accurate from three months onwards. We also recommend a minimum of six months’ data history.
If you’d like to learn more, take a look at this video.
5. Energy Consumption by Surface Area (kWh/m²)
Energy consumption by surface area is an example of a basic metric that you can easily and automatically track in DEXMA. Simply click on the Ratios tab from the Locations screen, and select “Ratio by the parameter”. For the full list of parameters trackable in DEXMA, click here.
Internationally, many countries require the kilowatt-hour per square meter metric to obtain an Energy Performance Certificate or energy rating, especially in the housing and real estate sector. Note that energy from other sources besides electricity should be included in this metric, so make sure to add sources like gas or thermal in your analysis.
6. Energy Consumption by Occupancy
This is another example ratio by parameter, that can especially be useful for buildings with variable occupancy like hotels. To be able to track ratios like occupancy in DEXMA, make sure you have the relevant occupancy data. Learn how to import occupancy data correctly here.
7. Energy Consumption by Degree Days (kWh/DD)
DD refers to degree days, a simplified type of historical weather data calculated based on outside air temperature readings. Since DD data is easy to access and use, many energy managers use it to model the relationship between energy consumption and outside air temperature or to see if internal systems are reacting correctly to external conditions.
Heating degree days refer to how much (in degrees), and for how long (in days) outside air temperature was lower than a specific base temperature. These are used for calculations relating to the energy consumption required to heat buildings. Cooling degree days measure by how much and for how long outside air temperature was higher than a specific base temperature, in order to calculate the energy consumption required to cool buildings.
DEXMA can automatically calculate both heating and cooling degree days, or addition of both – find out how here.
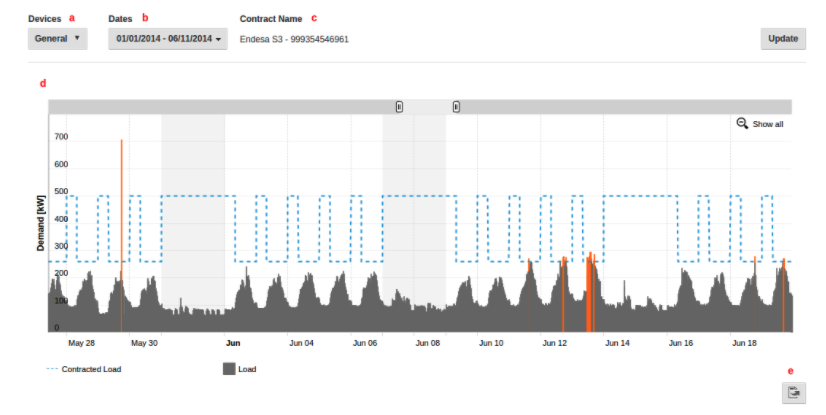
8. Peak Load Demand
It is important to keep an eye on peak load demand, especially in countries where you can have penalties if you exceed the contracted load. In the UK, this excess charge amount was set to triple in 2018 due to DCP 228 and DCP161. Using the Load Demand app, you can check the summary table with the breakdown by periods of each contracted load, the excess load and find the associated cost you should see on your energy bill.
9. Base Load and Weekly Utilisation Factor
These can be found on the list of the most important energy indicators an energy manager should check every week in order to understand how energy cost is influenced by base load consumption. Energy managers must have a look at the “Base load %” and “Weekly Utilisation Factor” (UF) which can be found under the “Main Indicators” section of the Weekly Pro report in DEXMA:
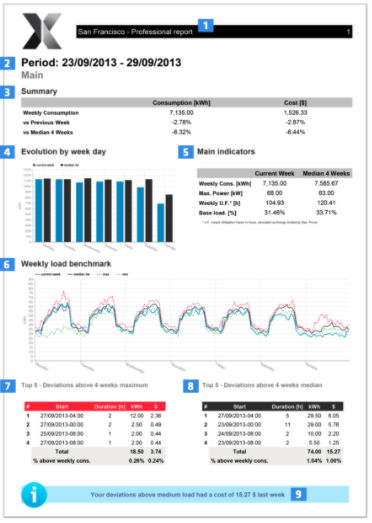
Base load percentage refers to how much power is used all the time, while the second one shows how many full utilisation hours a week a facility uses. Weekly UF is calculated as energy divided by Max. Power (kW).
10. Carbon Footprint and Greenhouse Gas Emissions
According to the World Resources Institute, at least 40 countries currently have mandatory emissions reporting programs in place. In the UK, listed companies have reported GHG emissions under mandatory reporting rules since 2013. Certain sub-regions, such as California, also have mandatory GHG reporting programs. As climate change mitigation continues to rise on national agendas worldwide, energy managers can expect to see more of these mandatory emissions reporting regulations – so it’s a good idea to have this metric down pat.
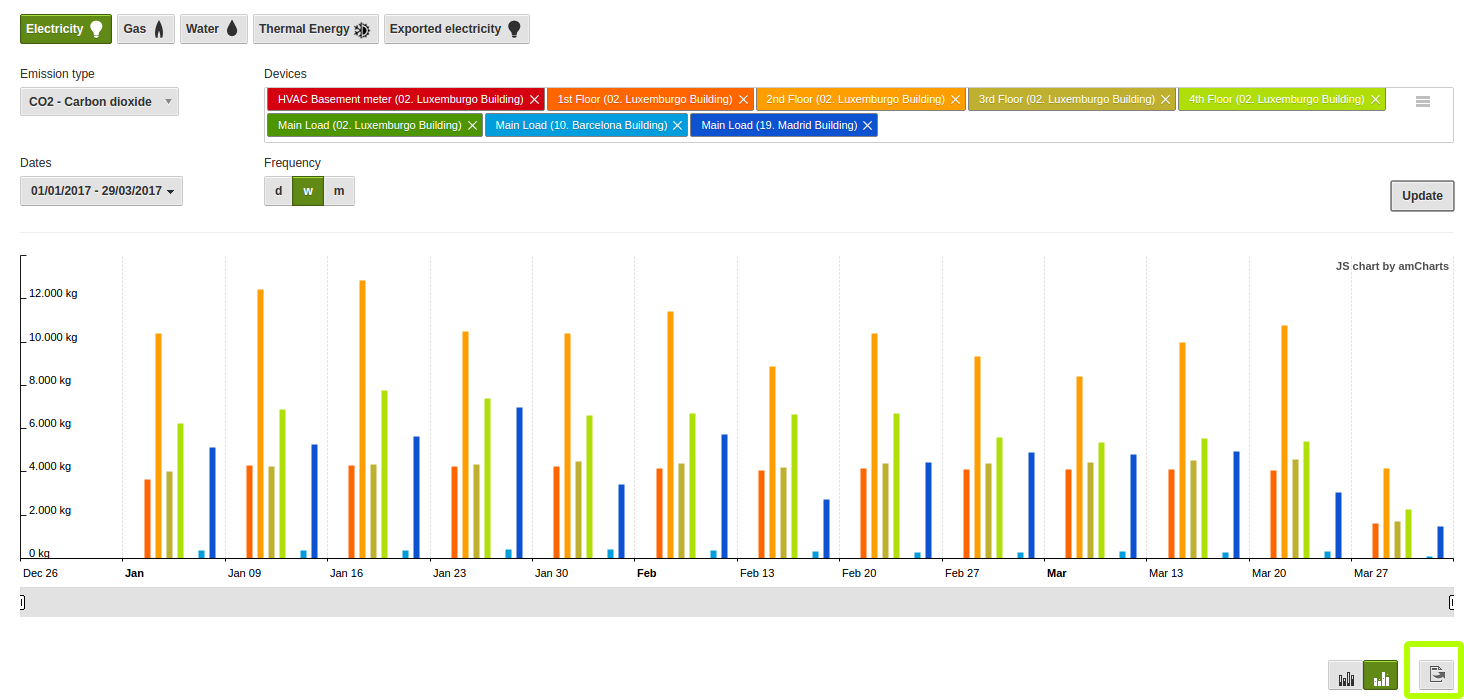
In DEXMA, you can use the Carbon App to track up to 9 different greenhouse gas emissions (methane, nitrous oxide…) from all your energy sources, and export the results to an Excel spreadsheet.
It’s essential to know the carbon conversion factors you need to apply to the emissions you want to calculate. Governments with mandatory reporting requirements usually provide Excel files with all the emission conversion factors you need on their websites. For example, the UK carbon conversion factors for 2020 can be downloaded here.
Once you have introduced your emissions factors and set up which loads and periods you want to measure, you can check the final analysis of each energy source and emission type with 3 available frequencies: daily, weekly and monthly:
Ready to play around with some real energy consumption data and check out some of these metrics for yourself? Try DEXMA for free: